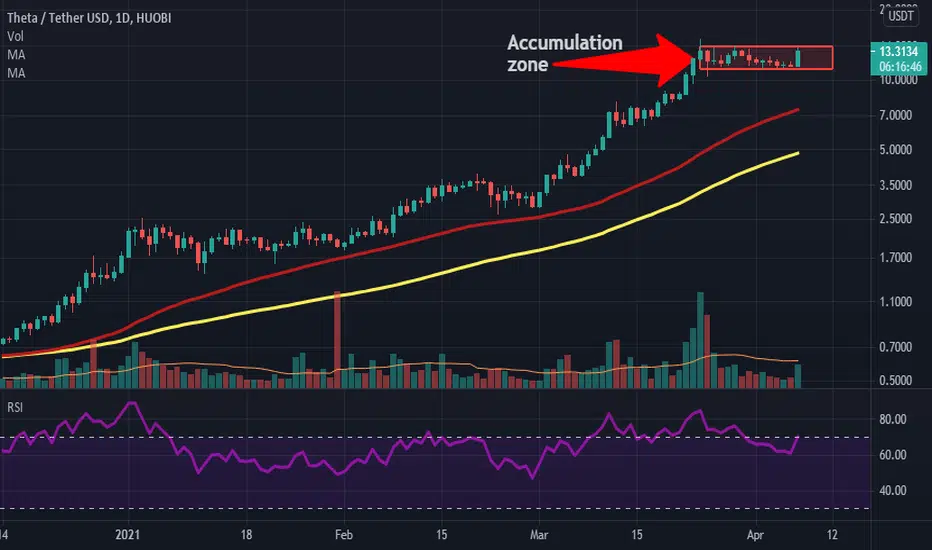
The weekly technical chart of THETA showcases a consolidated momentum. On coming to the daily chart's shorter time frame, THETA price is above 100 and 50 Moving average. The 500 MA(Red) line is at $7.2, making it temporary support for the coin. Resistance for the coin on going upside is at $15. While on the downside, the coin can see a bounceback from $11.There is a formation of the accumulation zone on the daily chart. If the price goes above the zone, then a new high can be formed.THETA/BTC pair is currently performing positively and can break the resistance created in the past.
Kindly comment your thoughts below
Kindly comment your thoughts below
Related publications
Disclaimer
The information and publications are not meant to be, and do not constitute, financial, investment, trading, or other types of advice or recommendations supplied or endorsed by TradingView. Read more in the Terms of Use.
Related publications
Disclaimer
The information and publications are not meant to be, and do not constitute, financial, investment, trading, or other types of advice or recommendations supplied or endorsed by TradingView. Read more in the Terms of Use.