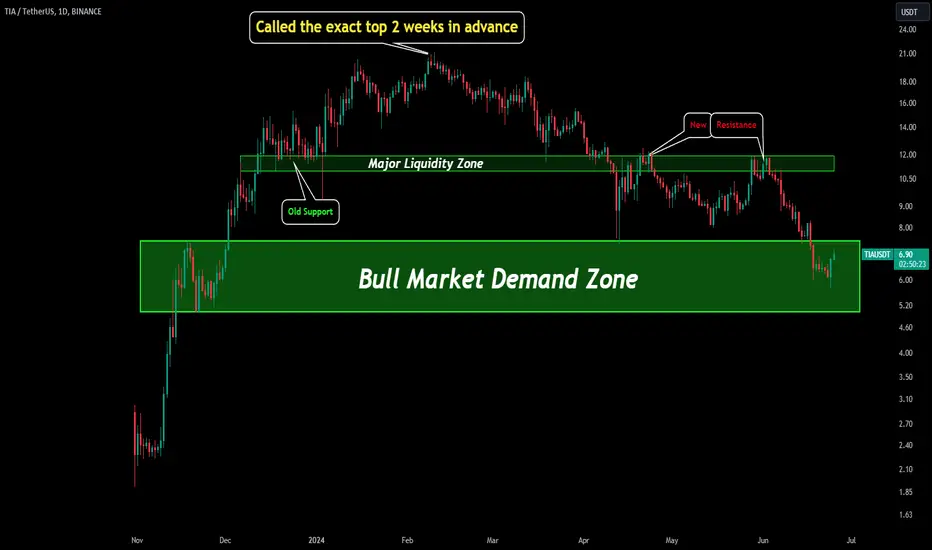
Here I wanted to update our Tia chart and outline a few of our old predictions that have acted as important levels.
Where we predicted TIA's next top two weeks before it happened:
https://tradingview.sweetlogin.com/chart/TIAUSDT/88s9Zgnk-TIA-Upside-Targets/
Major Liquidity Zone Identified: (S&R flips)
https://tradingview.sweetlogin.com/chart/TIAUSDT/KyfBBsLE-TIA-Building-Structure/
Now, lets look at Tia's current structure. The most important level where we have seen institutional interest is between $5-$7.40.
We should easily see a 100% move back to the liquidity zone that sits between $11-12. If we are able to flip that zone back into support then we could go to new all time highs.
Disclaimer
The information and publications are not meant to be, and do not constitute, financial, investment, trading, or other types of advice or recommendations supplied or endorsed by TradingView. Read more in the Terms of Use.
Disclaimer
The information and publications are not meant to be, and do not constitute, financial, investment, trading, or other types of advice or recommendations supplied or endorsed by TradingView. Read more in the Terms of Use.