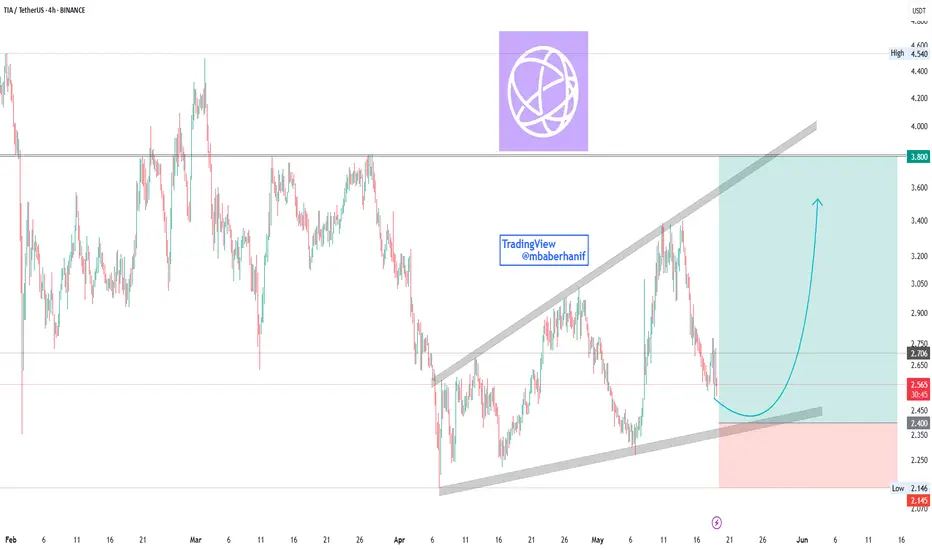
This chart of TIA/USDT on the 4-hour timeframe. Here's a breakdown of the chart and what it's suggesting:
1. Pattern: Ascending Channel
The price appears to be moving within an ascending channel (marked by two parallel trendlines).
The support and resistance levels of the channel are well defined, suggesting a bullish structure overall.
2. Current Price Action
Price is currently at $2.536, nearing the lower boundary (support) of the ascending channel.
There is a blue curved arrow, suggesting a bullish bounce off the support line and a move toward the upper boundary of the channel.
3. Trade Setup (Long Position)
Entry Zone: Near current level ($2.53), just above the support.
Stop Loss (Red Box): Below the channel support, around $2.15.
Target (Green Box): Near the top of the channel, around $3.80.
This sets up a favorable risk-to-reward ratio ( 1 : 5.5 )).
4. Support & Resistance
Key Support: ~$2.15 (stop-loss level), channel bottom.
Immediate Resistance: ~$2.75 (mid-channel zone).
Major Resistance (Target): ~$3.80 (channel top).
Conclusion
This chart suggests a bullish trade idea, based on:
Price rebounding from the bottom of a rising channel.
Strong risk-reward setup (target ~$3.80, stop ~$2.15).
If the support fails, the setup is invalidated with limited downside risk.
Trade closed: stop reached
Disclaimer
The information and publications are not meant to be, and do not constitute, financial, investment, trading, or other types of advice or recommendations supplied or endorsed by TradingView. Read more in the Terms of Use.
Disclaimer
The information and publications are not meant to be, and do not constitute, financial, investment, trading, or other types of advice or recommendations supplied or endorsed by TradingView. Read more in the Terms of Use.