SUBSCRIBE, BOOST AND COMMENT IN ORDER TO GET HIGH QUALITY TECHNICAL ANALYSIS.
Firstly, our Algo-based indicators are used to create this analysis.
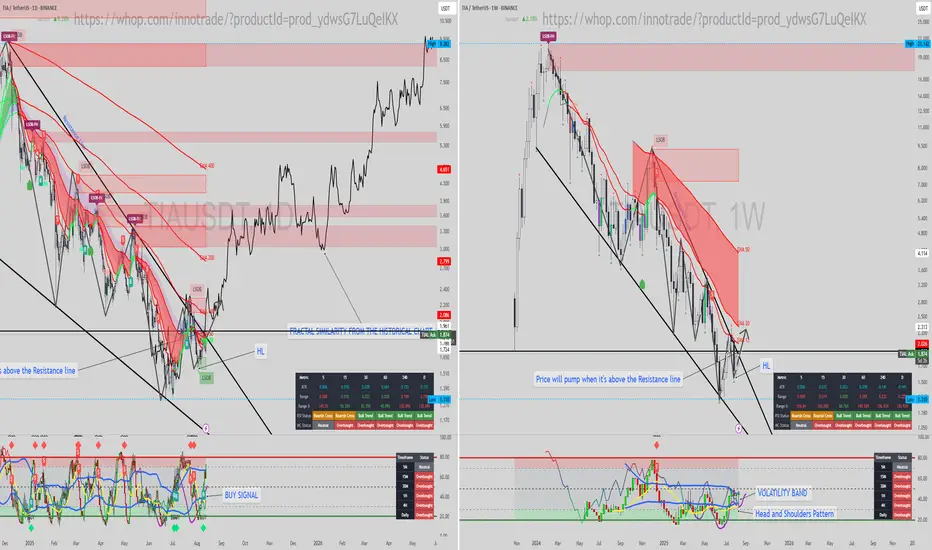
Daily (1D) & Weekly (1W) Analysis:
TIA/USDT has been in a sustained downtrend, but price is now tightening within a classic bullish pattern, suggesting a significant move may be imminent.
Key Observations:
Bullish Wedge: The price is consolidating within a large falling wedge, a strong bullish reversal pattern. A breakout to the upside is the confirmation we're watching for.
Primary Trigger: A decisive break and hold above the wedge's descending resistance line is the critical signal for a bullish reversal. Analysis suggests a significant price pump could follow.
Bullish Divergence & Signals:
On the daily chart, a clear "BUY SIGNAL" has been triggered on the momentum indicator.
The weekly indicator shows a potential inverse Head and Shoulders pattern developing, adding weight to the reversal case in our Market Cycle Orderflow indcator.
Fractal Projection: Historical fractal analysis projects a highly bullish path for TIA if it successfully breaks the current downtrend structure.
Conclusion:
The combination of a bullish falling wedge, a daily buy signal, and a potential weekly bottoming pattern strongly indicates a reversal may be near. The key confirmation remains a breakout above the wedge's resistance. Until then, this is a prime chart to watch.
Firstly, our Algo-based indicators are used to create this analysis.
Daily (1D) & Weekly (1W) Analysis:
TIA/USDT has been in a sustained downtrend, but price is now tightening within a classic bullish pattern, suggesting a significant move may be imminent.
Key Observations:
Bullish Wedge: The price is consolidating within a large falling wedge, a strong bullish reversal pattern. A breakout to the upside is the confirmation we're watching for.
Primary Trigger: A decisive break and hold above the wedge's descending resistance line is the critical signal for a bullish reversal. Analysis suggests a significant price pump could follow.
Bullish Divergence & Signals:
On the daily chart, a clear "BUY SIGNAL" has been triggered on the momentum indicator.
The weekly indicator shows a potential inverse Head and Shoulders pattern developing, adding weight to the reversal case in our Market Cycle Orderflow indcator.
Fractal Projection: Historical fractal analysis projects a highly bullish path for TIA if it successfully breaks the current downtrend structure.
Conclusion:
The combination of a bullish falling wedge, a daily buy signal, and a potential weekly bottoming pattern strongly indicates a reversal may be near. The key confirmation remains a breakout above the wedge's resistance. Until then, this is a prime chart to watch.
Disclaimer
The information and publications are not meant to be, and do not constitute, financial, investment, trading, or other types of advice or recommendations supplied or endorsed by TradingView. Read more in the Terms of Use.
Disclaimer
The information and publications are not meant to be, and do not constitute, financial, investment, trading, or other types of advice or recommendations supplied or endorsed by TradingView. Read more in the Terms of Use.