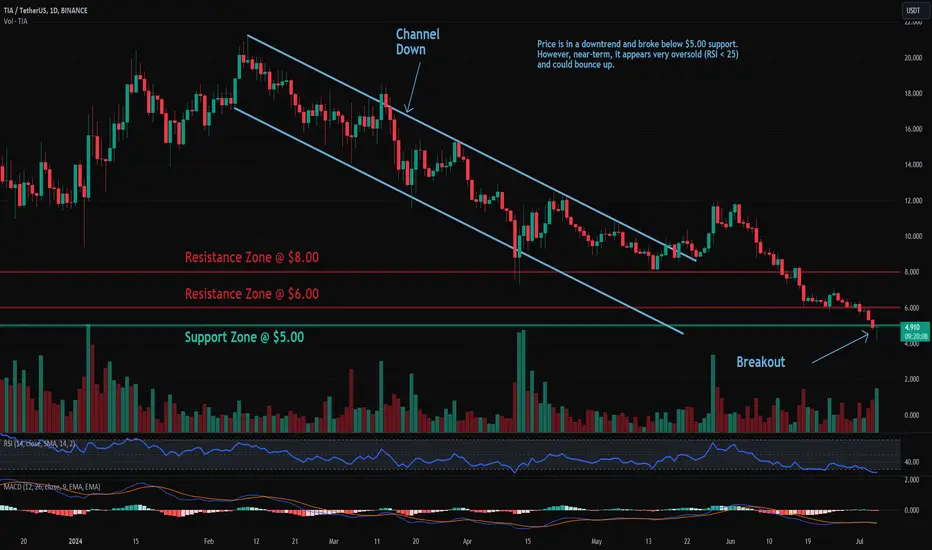
Trade setup: Price is in a downtrend and broke below $5.00 support. However, near-term, it appears very oversold (RSI < 25) and could bounce up.
Pattern: Support Breakout. Once a price breaks below a support zone, it signals that supply from sellers has overwhelmed demand from buyers at this level and price is likely to decline further. Following a support breakout, the next closest support zone becomes a price target. Learn to trade key levels breakouts in Lesson 7.
Trend: Short-term trend is Strong Down, Medium-term trend is Strong Down and Long-term trend is Strong Down.
Momentum: Price is Oversold currently, based on RSI-14 levels (RSI < 30).
Support and Resistance: Nearest Resistance Zone is $6.00, then $8.00.
Disclaimer
The information and publications are not meant to be, and do not constitute, financial, investment, trading, or other types of advice or recommendations supplied or endorsed by TradingView. Read more in the Terms of Use.
Disclaimer
The information and publications are not meant to be, and do not constitute, financial, investment, trading, or other types of advice or recommendations supplied or endorsed by TradingView. Read more in the Terms of Use.