Technical Analysis for TTLM/USDT
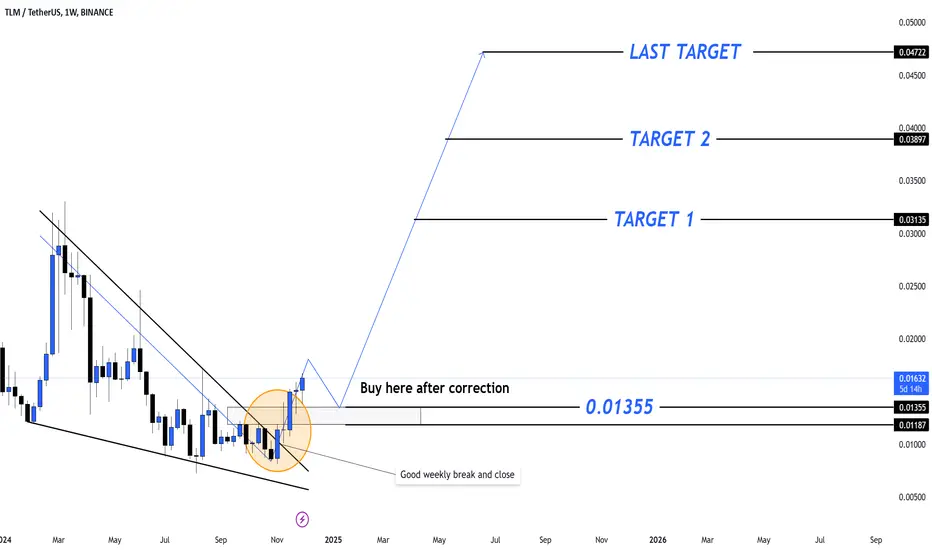
#TLM The chart displays a falling wedge breakout, a bullish reversal pattern that signals a shift from a downtrend to an uptrend.
The "Buy here after correction" zone at $0.01355 serves as a strong support and an ideal entry point for long positions during a retracement.
$0.01355 - $0.01187: Key support zone, marking the Fibonacci retracement area and a critical zone for potential accumulation.
Resistance Levels (Targets):
T1: $0.03115
T2: $0.03897
Last Target: $0.04772
Subscribe to my Telegram Channel 👉 :
t.me/addlist/y5mi70s3c0Y3MDQ0
Subscribe to my X 👉 : x.com/VIPROSETR
t.me/addlist/y5mi70s3c0Y3MDQ0
Subscribe to my X 👉 : x.com/VIPROSETR
Disclaimer
The information and publications are not meant to be, and do not constitute, financial, investment, trading, or other types of advice or recommendations supplied or endorsed by TradingView. Read more in the Terms of Use.