I have decided to share the evolution of this charting concept
It centres upon:
pivots
Geometry
TIME
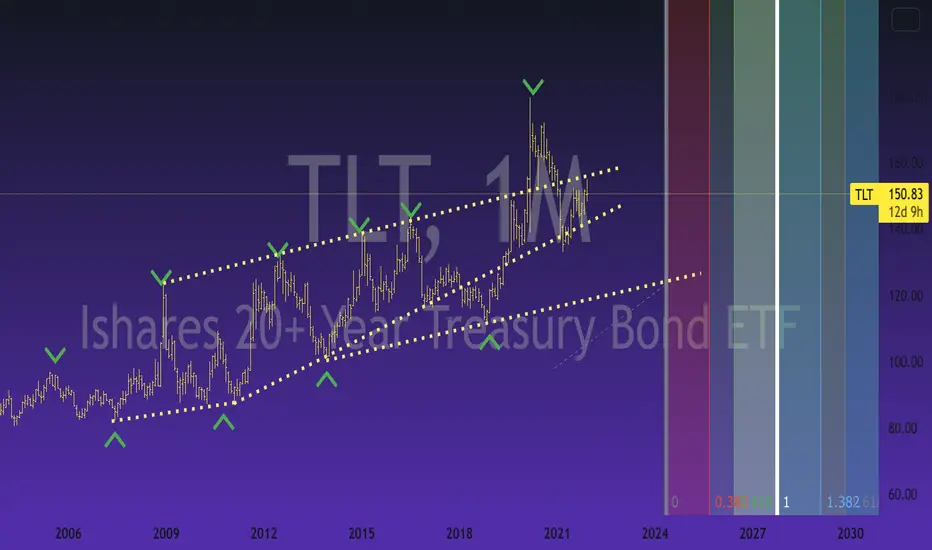
Here we have the macro chart for TLT, a marker of risk on; and the bellwether for the 40 year bond bull market vs the current 'inflation' narrative
Here I have marked the major pivots and trendlines which relate to the cycles
It centres upon:
pivots
Geometry
TIME
Here we have the macro chart for TLT, a marker of risk on; and the bellwether for the 40 year bond bull market vs the current 'inflation' narrative
Here I have marked the major pivots and trendlines which relate to the cycles
Note
Here we can subdivide the chart into circa 3 year cycles, and also use fibonacci on the time periodsDisclaimer
The information and publications are not meant to be, and do not constitute, financial, investment, trading, or other types of advice or recommendations supplied or endorsed by TradingView. Read more in the Terms of Use.
Disclaimer
The information and publications are not meant to be, and do not constitute, financial, investment, trading, or other types of advice or recommendations supplied or endorsed by TradingView. Read more in the Terms of Use.