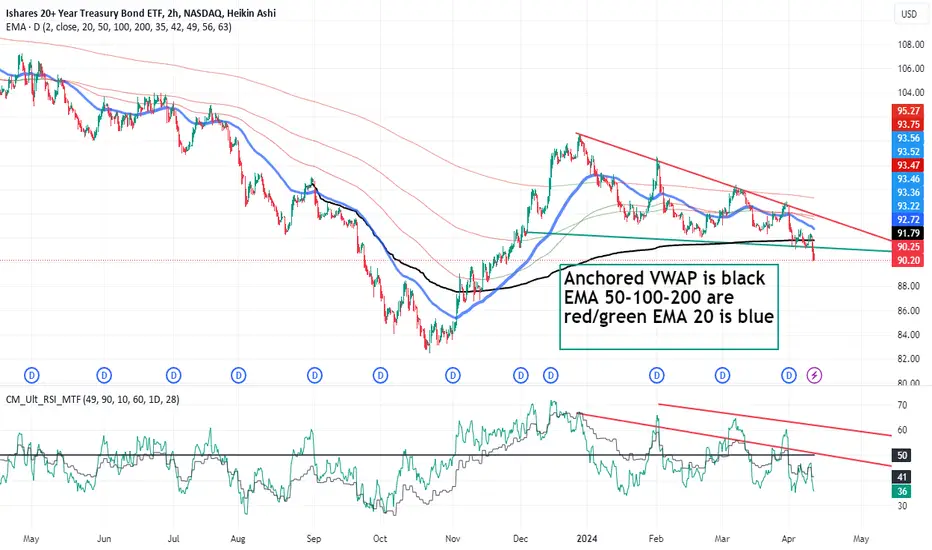
TLT on a 120 minute chart has continued its trend down since early December after a suddent
uptrend in November lasting for a two month until the end of 2023.
Inflation data is kicking the rate cut down the road of time.
Price has now fallen under the VWAP and all of the EMA lines including the EMA20.
Relative strength trending correlates with price. I conclude, TLT continues to be set up
SHORT or alternatively TBT LONG. I will take short trades at weekly highs on a 30-60
minute chart until signs of a reversal are seen on the chart.
Note
Short share trade taken today on the high of day. Averaging in over a spread of time.Disclaimer
The information and publications are not meant to be, and do not constitute, financial, investment, trading, or other types of advice or recommendations supplied or endorsed by TradingView. Read more in the Terms of Use.
Disclaimer
The information and publications are not meant to be, and do not constitute, financial, investment, trading, or other types of advice or recommendations supplied or endorsed by TradingView. Read more in the Terms of Use.