TLT 1H Technical Analysis
📈 Outlook:
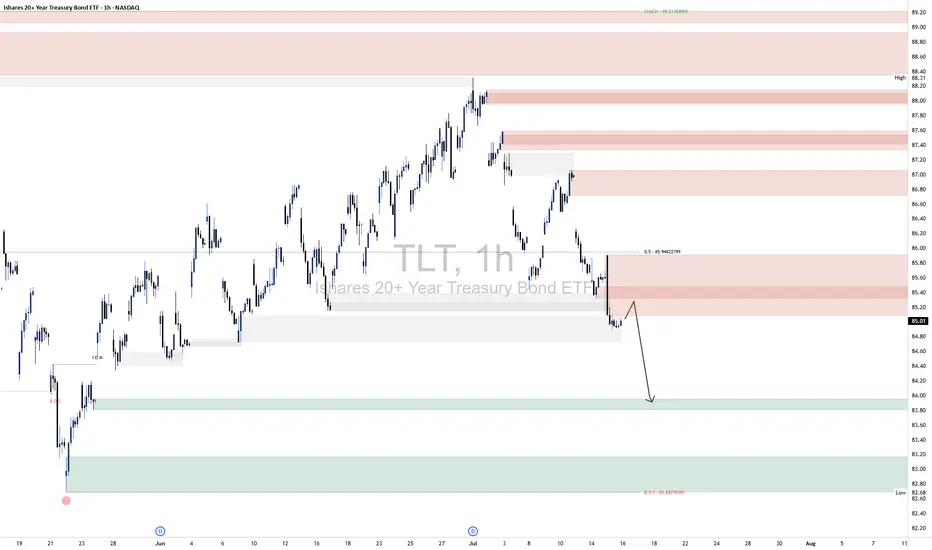
The current setup suggests a bearish continuation scenario:
A corrective move toward the 85.20–85.60 supply.
Rejection from this area confirms continuation of the downtrend.
Target: 83.20–83.60, where resting liquidity and untested demand reside.
This sequence follows a classic liquidity sweep + supply mitigation + continuation pattern. Unless price breaks convincingly above 85.80, the bearish outlook remains intact.
🔼 Supply Zones (Bearish Liquidity Layers):
Primary Zone: 85.20–85.60
This is the most immediate area of interest, aligning closely with the 50% equilibrium level of the last bearish impulse (~85.84). Price is likely to reject from here as it also coincides with a previously unmitigated supply block and market inefficiency.
Stacked Supply Above: 86.40–88.00
Should price break the lower supply, these zones will come into play. However, the current structure suggests strong probability of rejection before reaching these levels.
🔽 Demand Zones (Target Areas):
First Demand: 83.20–83.60
This is your marked initial downside target. It represents the next logical draw on liquidity and aligns with prior accumulation and support structure. It’s likely to act as a temporary reaction zone or the next entry point for accumulation.
Deeper Demand Zone: 82.40–82.80
Marked by your secondary border, this range offers higher time-frame confluence and could act as the final sweep zone if the 83s fail to hold.
📈 Outlook:
The current setup suggests a bearish continuation scenario:
A corrective move toward the 85.20–85.60 supply.
Rejection from this area confirms continuation of the downtrend.
Target: 83.20–83.60, where resting liquidity and untested demand reside.
This sequence follows a classic liquidity sweep + supply mitigation + continuation pattern. Unless price breaks convincingly above 85.80, the bearish outlook remains intact.
🔼 Supply Zones (Bearish Liquidity Layers):
Primary Zone: 85.20–85.60
This is the most immediate area of interest, aligning closely with the 50% equilibrium level of the last bearish impulse (~85.84). Price is likely to reject from here as it also coincides with a previously unmitigated supply block and market inefficiency.
Stacked Supply Above: 86.40–88.00
Should price break the lower supply, these zones will come into play. However, the current structure suggests strong probability of rejection before reaching these levels.
🔽 Demand Zones (Target Areas):
First Demand: 83.20–83.60
This is your marked initial downside target. It represents the next logical draw on liquidity and aligns with prior accumulation and support structure. It’s likely to act as a temporary reaction zone or the next entry point for accumulation.
Deeper Demand Zone: 82.40–82.80
Marked by your secondary border, this range offers higher time-frame confluence and could act as the final sweep zone if the 83s fail to hold.
Looking for powerful AI trading signals? Visit ProSignal.ai and take your trading to the next level! or join our telegram channel at t.me/prosignalai
Disclaimer
The information and publications are not meant to be, and do not constitute, financial, investment, trading, or other types of advice or recommendations supplied or endorsed by TradingView. Read more in the Terms of Use.