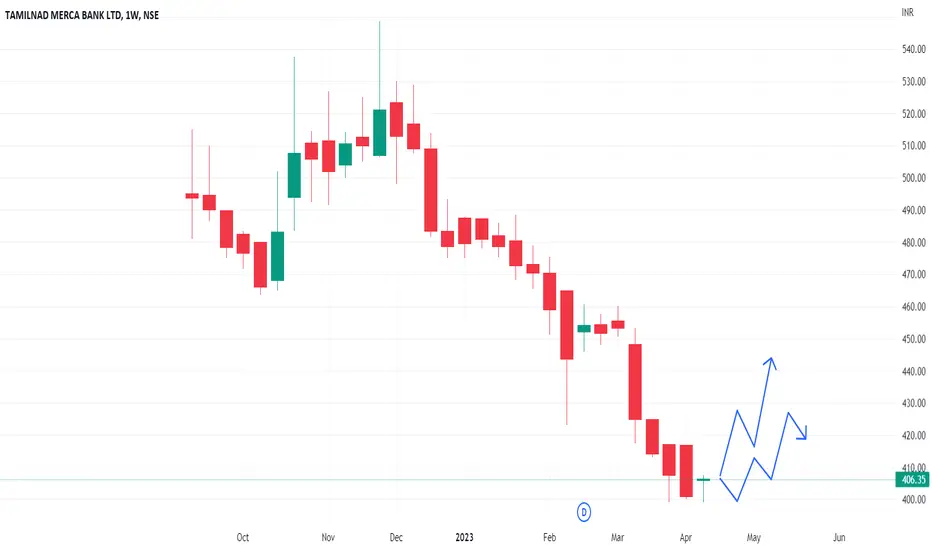
In the Weekly Chart of TMB ,
we can see that, it has created a Bullish hammer candle.
2 possible momentum has been shown in chart.
we can see that, it has created a Bullish hammer candle.
2 possible momentum has been shown in chart.
Disclaimer
The information and publications are not meant to be, and do not constitute, financial, investment, trading, or other types of advice or recommendations supplied or endorsed by TradingView. Read more in the Terms of Use.
Disclaimer
The information and publications are not meant to be, and do not constitute, financial, investment, trading, or other types of advice or recommendations supplied or endorsed by TradingView. Read more in the Terms of Use.