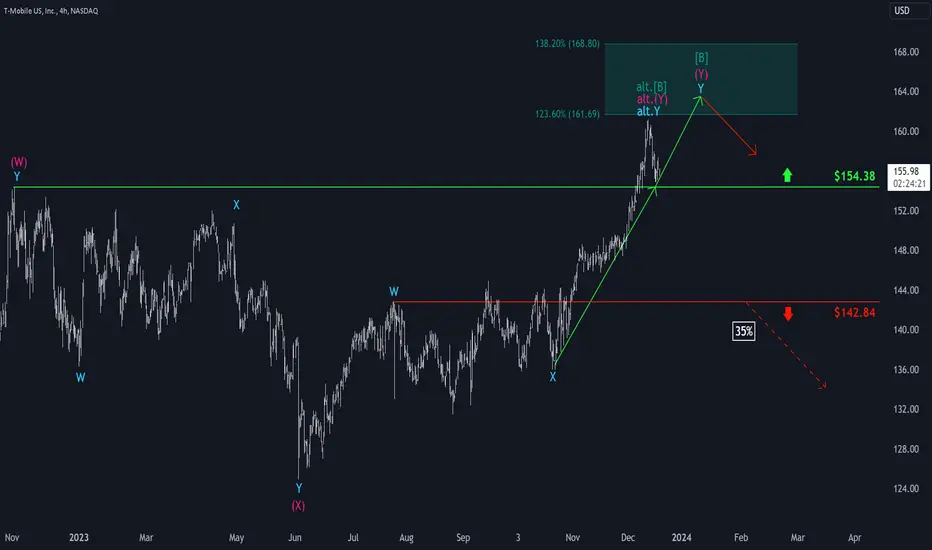
The share price of T-Mobile has come very close to our dark green Target Zone (coordinates: $161.69 - $168.80) in the past weeks, but has turned around underneath it. In the context of an alternative count, it is now 35% likely that we have already seen the top with the wave alt.(B) in dark green, which would mean that we are now already seeing a sell-off to below the support at $142.84. Primarily, however, we assume that the course of the regular wave (B) in dark green will prevail and thus lead to the scheduled top in our Target Zone, which, by the way, potentially offers itself as a short opportunity.
📊 Free daily market insights combining macro + Elliott Wave analysis
🚀 Spot trends early with momentum, sentiment & price structure
🌐 Join thousands trading smarter - full free analyses at dailymarketupdate.com
🚀 Spot trends early with momentum, sentiment & price structure
🌐 Join thousands trading smarter - full free analyses at dailymarketupdate.com
Related publications
Disclaimer
The information and publications are not meant to be, and do not constitute, financial, investment, trading, or other types of advice or recommendations supplied or endorsed by TradingView. Read more in the Terms of Use.