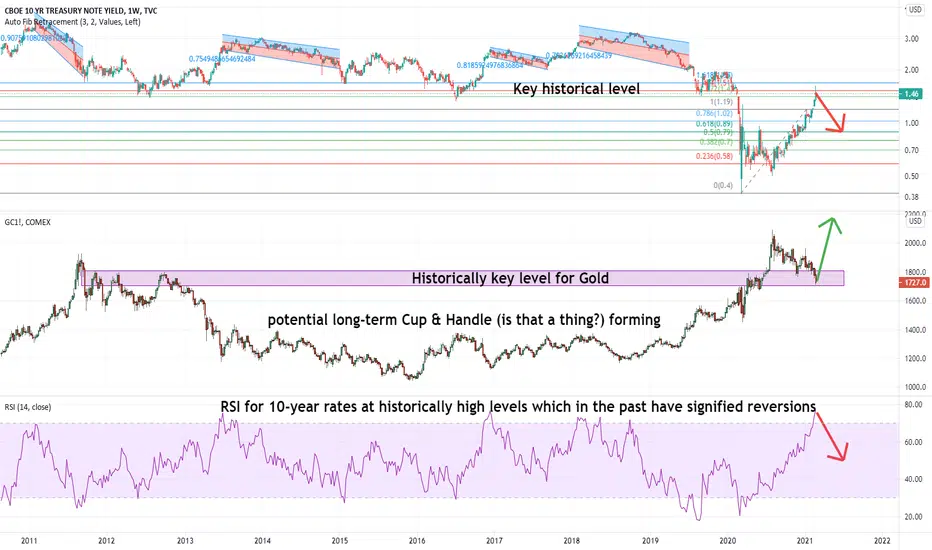
After a long downtrend that is starting to look like a bull-flag type pattern, gold has reached a historically important level - which has corresponded with multiple inflection points since 2011 (including March 2020).
Gold has a clear negative relationship with 10 year rates - which are also at a key historical inflection point in a sharp rise amid a multi-year secular downtrend. Rates are already rejecting hard off a key fib level (red line), and we should expect them to go down in the coming months. Furthermore, the 10-year RSI is at historically high levels. Previous iterations over 70 have usually corresponded with the start of major declines in 10-year rates.
All these factors together suggest now is the time to go long on Gold.
Note
Hey, well at least Gold is up.Note
Double bottom formed, breakout confirmed. Also, TNX rejected off the fib line just as expected and is now down more than 20 points from the highs.
Gold is hella bullish.
Disclaimer
The information and publications are not meant to be, and do not constitute, financial, investment, trading, or other types of advice or recommendations supplied or endorsed by TradingView. Read more in the Terms of Use.
Disclaimer
The information and publications are not meant to be, and do not constitute, financial, investment, trading, or other types of advice or recommendations supplied or endorsed by TradingView. Read more in the Terms of Use.