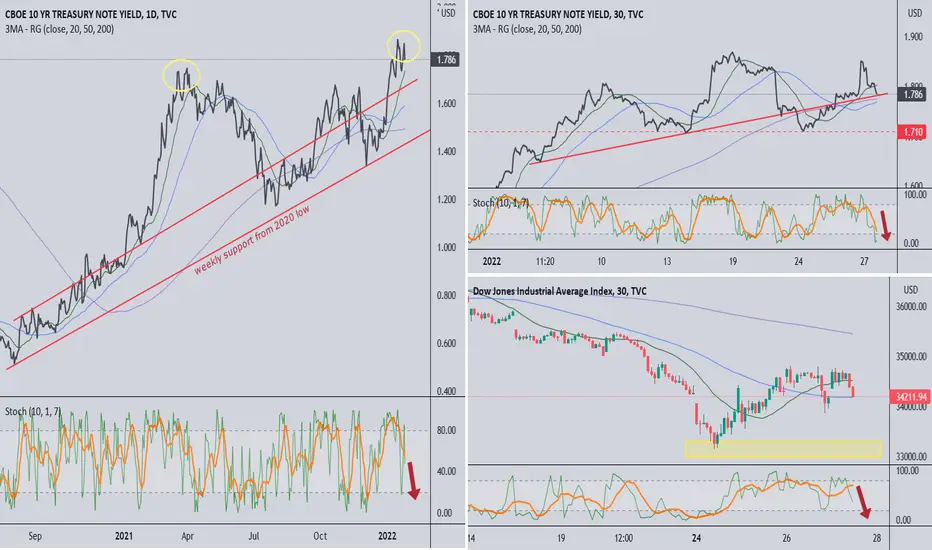
Stochastic %D is headed lower on all three charts. I will probably remain bearish until SKEW and fear/greed indicators signal "time to buy"
Left chart:
> daily 10yr yield may be a double top and it comes down from here
> markets are positively correlated with yield movements for now
> yield is at 200ma resistance on weekly chart
> yield will respond - how? - to Fed balance reduction and no more asset purchases
Top right chart:
> 30min chart of 10yr yield shows 1.71 is critical level
> there is a lag between yield and market movement, so swing trades will work well
> lower yields may initially cause markets to rise, so be ready for market turns and take profits
Bottom right chart
> 30m chart of Dow Jones is an example of markets heading lower to retest lows
> when you look at daily/weekly charts, it is likely that markets move even lower
> stocks that look "sold off" on 30m/daily still have room down on weekly
> at the same time, markets may bounce first on lower yields, as there is room on daily to move up to 20sma
Note
One clarification - while I remain bearish on the larger timeframes, I am currently looking for call trades as markets may bounce. Looking at FB, NFLX - allow time for bottoming before bounce. Be conservative with capital per trade.Disclaimer
The information and publications are not meant to be, and do not constitute, financial, investment, trading, or other types of advice or recommendations supplied or endorsed by TradingView. Read more in the Terms of Use.
Disclaimer
The information and publications are not meant to be, and do not constitute, financial, investment, trading, or other types of advice or recommendations supplied or endorsed by TradingView. Read more in the Terms of Use.