Long
TNY.
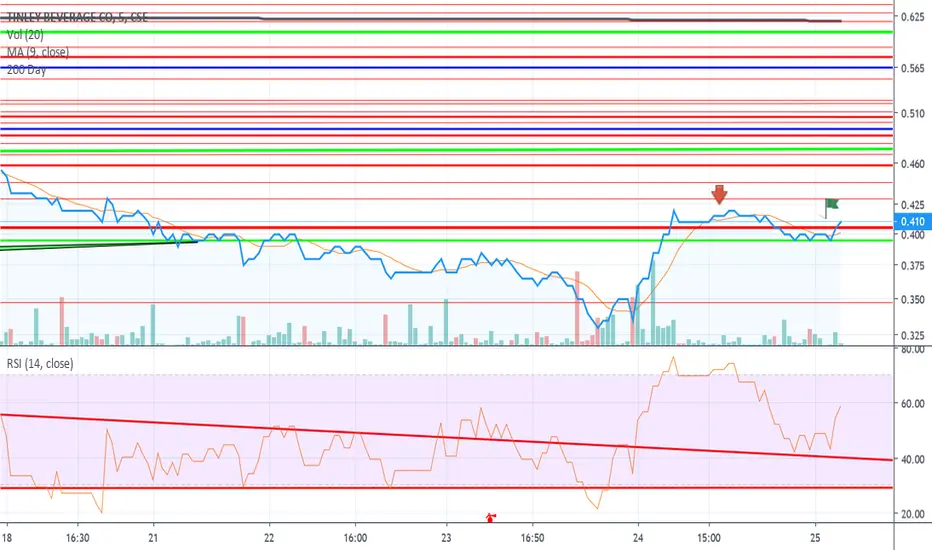
This is the same chart but a 5 day time frame, and you'll notice the rsi bounce off the top what was a descending triangle. Old resistance becoming new support, can be considered bullish & is often indicative of a trend change.
Disclaimer
The information and publications are not meant to be, and do not constitute, financial, investment, trading, or other types of advice or recommendations supplied or endorsed by TradingView. Read more in the Terms of Use.
Disclaimer
The information and publications are not meant to be, and do not constitute, financial, investment, trading, or other types of advice or recommendations supplied or endorsed by TradingView. Read more in the Terms of Use.