Long
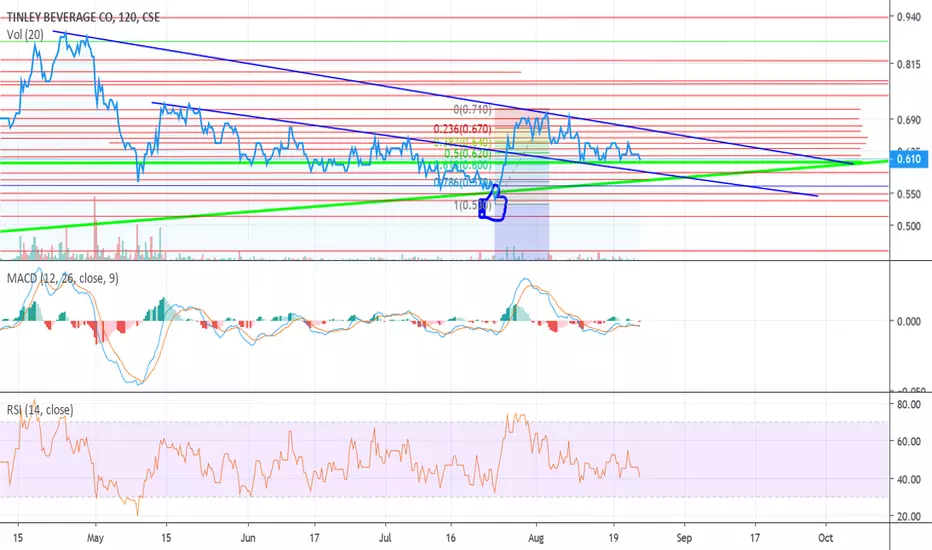
TNY is trading on the 0.618 Fibonacci & RSI is low 40.

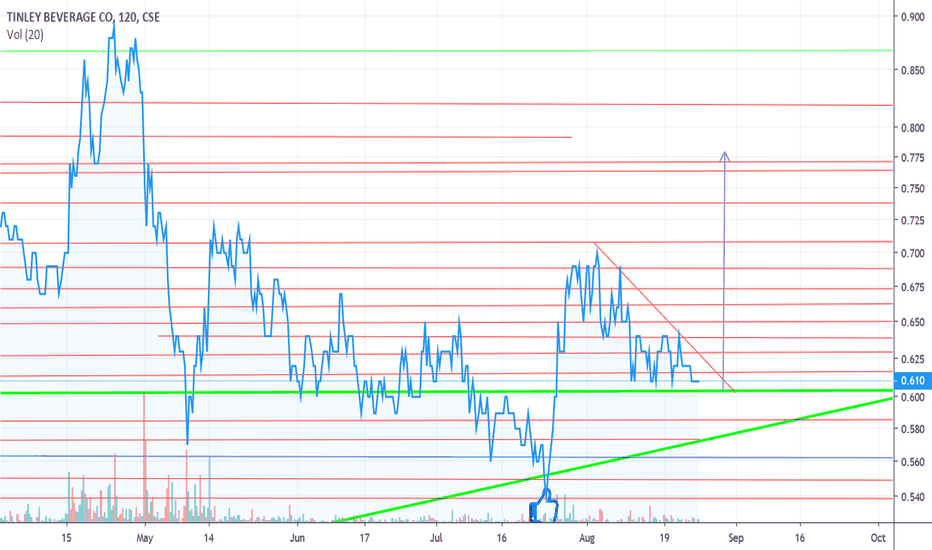
Tinley seems to be trading in a Bull Flag or a Descending Triangle.
Note
Notice where the 0.618 Fibonacci is? Right at the top of a ascending triangle that was broken flush to the upside after the descending triangle broke to the downside on a short term time frame. Zoom in on the chart if this isn't apparent at first. The gap up in price came upon news of expansion to Canada, but it wasn't even material, anything material in that regard "should" break us flush through 72c.
Many different catalyst for this company in the next several weeks, months & years to come! Stay thirsty!
Time will tell per usual.
Note
There may be a hidden bull flag, I'll update the chart after a few more trading days.Related publications
Disclaimer
The information and publications are not meant to be, and do not constitute, financial, investment, trading, or other types of advice or recommendations supplied or endorsed by TradingView. Read more in the Terms of Use.
Related publications
Disclaimer
The information and publications are not meant to be, and do not constitute, financial, investment, trading, or other types of advice or recommendations supplied or endorsed by TradingView. Read more in the Terms of Use.
