Technical picture
All key indicators, including RSI (≈56), STOCH, MACD, ADX and others, signal Buy. There is not a single "Sell" signal or
Moving averages on all timeframes (from MA5 to MA200) also give a stable Buy, without "Sell" signals
Pivot levels:
Current Pivot: $3.4271
Resistance: $3.4436 (R1), then $3.4629 and $3.4794
Conclusion: the overall sentiment is confidently bullish.
Additional signals:
Analysis by indicators: 1 Sell, 7 Neutral, 17 Buy - final signal: Strong Buy
Among the oscillators - 5 Buy signals, 5 Neutral, 0 Sell.
Moving Averages: 12 Buy, 2 Neutral, 1 Sell
Chart Shapes and Patterns
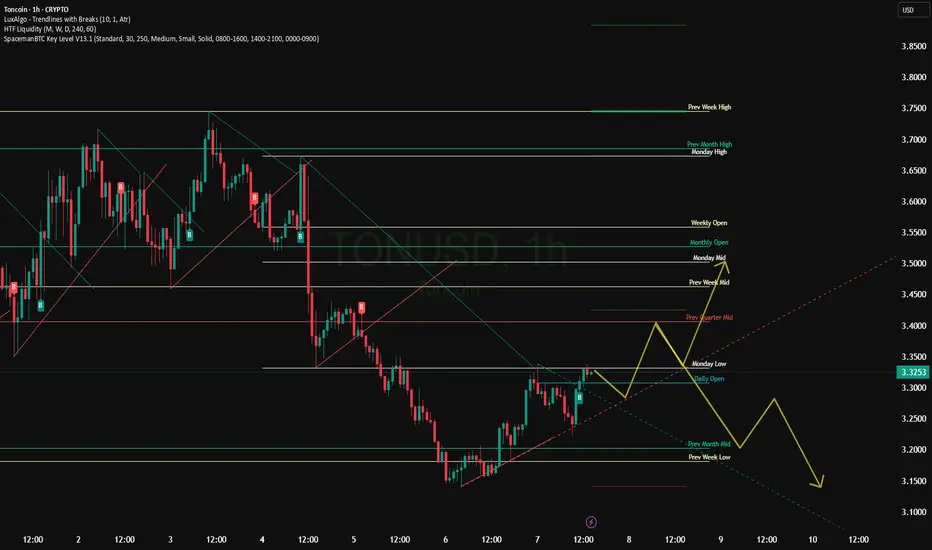
According to OKX Europe, Toncoin has exited a descending triangle, which often indicates a trend reversal
Support: $2.60 and $3.00. Resistance: $3.50 and $3.70
Upside Potential and Key Levels
Cryptodamus's final article emphasizes that the $4.00 zone (100-day MA) is key: a break above it could open the way to $5.48, and a failure to $2.90
Binance Square outlines immediate targets: $3.95-4.00, then $4.20-4.30, and a possible move to $4.50+ if the $3.91 level is broken
All key indicators, including RSI (≈56), STOCH, MACD, ADX and others, signal Buy. There is not a single "Sell" signal or
Moving averages on all timeframes (from MA5 to MA200) also give a stable Buy, without "Sell" signals
Pivot levels:
Current Pivot: $3.4271
Resistance: $3.4436 (R1), then $3.4629 and $3.4794
Conclusion: the overall sentiment is confidently bullish.
Additional signals:
Analysis by indicators: 1 Sell, 7 Neutral, 17 Buy - final signal: Strong Buy
Among the oscillators - 5 Buy signals, 5 Neutral, 0 Sell.
Moving Averages: 12 Buy, 2 Neutral, 1 Sell
Chart Shapes and Patterns
According to OKX Europe, Toncoin has exited a descending triangle, which often indicates a trend reversal
Support: $2.60 and $3.00. Resistance: $3.50 and $3.70
Upside Potential and Key Levels
Cryptodamus's final article emphasizes that the $4.00 zone (100-day MA) is key: a break above it could open the way to $5.48, and a failure to $2.90
Binance Square outlines immediate targets: $3.95-4.00, then $4.20-4.30, and a possible move to $4.50+ if the $3.91 level is broken
Disclaimer
The information and publications are not meant to be, and do not constitute, financial, investment, trading, or other types of advice or recommendations supplied or endorsed by TradingView. Read more in the Terms of Use.
Disclaimer
The information and publications are not meant to be, and do not constitute, financial, investment, trading, or other types of advice or recommendations supplied or endorsed by TradingView. Read more in the Terms of Use.