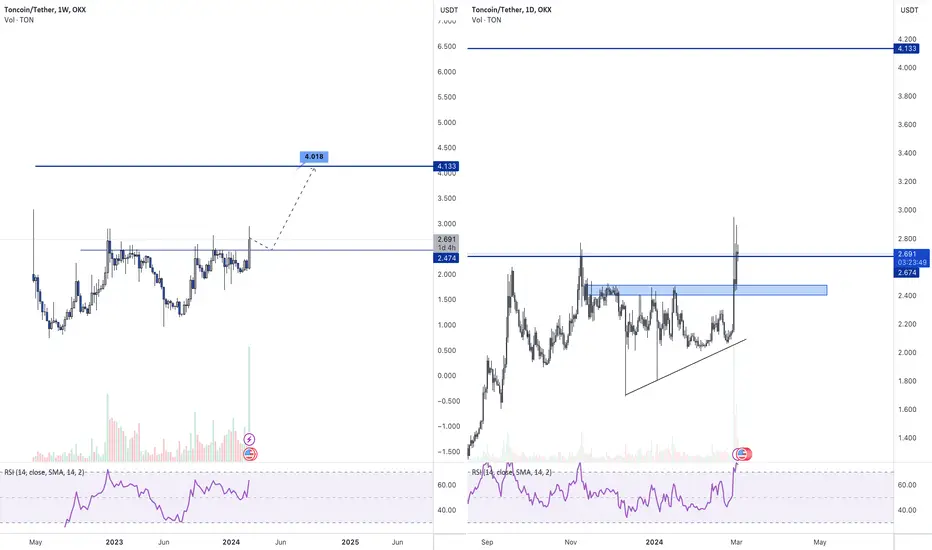
Left chart (weekly)
Right Chart (Daily)
- Inverse head and shoulder >> Bullish
- Target >> $4
Right Chart (Daily)
- Triangle broken to the upside >>> Bullish
- Potential short-term pull back, however the overall trend is bullish
Sayylees_Ideas
Disclaimer
The information and publications are not meant to be, and do not constitute, financial, investment, trading, or other types of advice or recommendations supplied or endorsed by TradingView. Read more in the Terms of Use.
Sayylees_Ideas
Disclaimer
The information and publications are not meant to be, and do not constitute, financial, investment, trading, or other types of advice or recommendations supplied or endorsed by TradingView. Read more in the Terms of Use.