🧾 1. Overview of the Chart Setup:
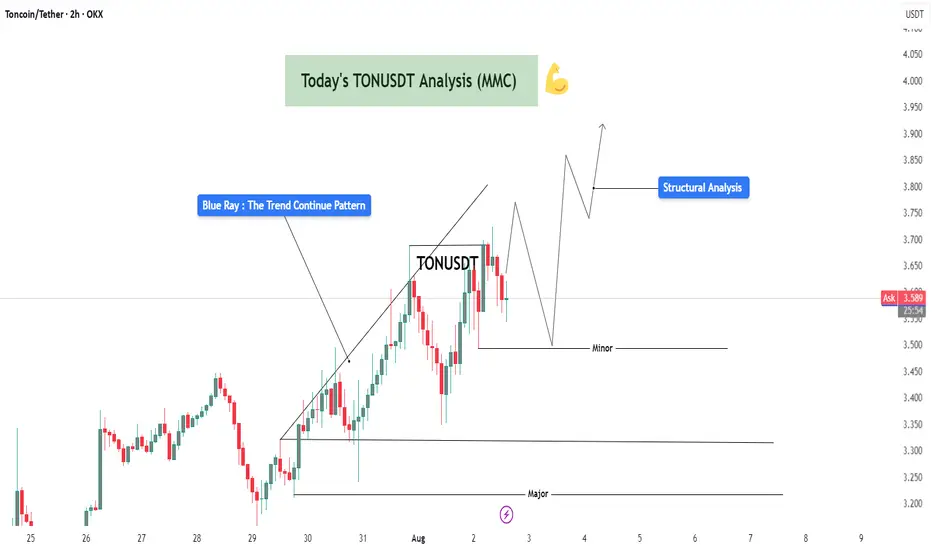
The current TONUSDT (Toncoin/USDT) 2-hour chart exhibits a strong bullish market structure, characterized by a clear sequence of higher highs and higher lows. This confirms bullish momentum and suggests that the market is in a well-established uptrend.
The key highlight here is the "Blue Ray – Trend Continuation Pattern", which signals sustained bullish pressure following a clean breakout. This breakout was preceded by a consolidation phase, indicating accumulation by smart money before the expansion move.
🔍 2. Technical Structure and Pattern Breakdown:
🔵 Blue Ray – Trend Continuation Pattern:
This diagonal support trendline captured the initial breakout after the market bottomed near July 29–30.
Price respected this ascending line multiple times before accelerating, confirming bullish control.
Once the price broke above the previous swing high, it completed the pattern and triggered a momentum-driven rally.
🔲 Structural Zones – Major and Minor:
Minor Support Zone (~3.50 USDT):
Currently acting as short-term demand.
Price is showing early signs of rejection here, suggesting bulls may reload for a second impulsive move.
If this zone holds, we expect a new higher high to form, potentially targeting 3.80–4.00+ USDT.
Major Support Zone (~3.20–3.25 USDT):
Acts as long-term bullish defense.
In case of deeper retracement or shakeout, this is the key level to watch for possible trend continuation and re-entry.
📈 3. Structural Analysis and Price Projection:
The projected path on the chart shows a classic price action structure:
This type of Elliott Wave-inspired behavior suggests we're in wave 3 or 5 of a bullish sequence, with minor dips offering low-risk long setups.
📊 4. Candlestick & Market Behavior:
Recent candles show long lower wicks, suggesting buyers are stepping in during dips.
Bearish candles are relatively smaller and followed by immediate bullish response.
This indicates buy-the-dip sentiment, common in a trending market.
🔄 5. Trading Plan & Scenarios:
✅ Bullish Continuation (Base Case):
Wait for a clear bullish engulfing or price bounce at the minor support zone (~3.50 USDT).
Enter with confirmation: bullish candle close, volume spike, or trendline reaction.
Targets:
TP1: 3.80 USDT
TP2: 4.00–4.10 USDT
Stop Loss: Below 3.45 (or structure-based trailing stop)
⚠️ Bearish Case / Deeper Pullback:
If 3.50 fails, look for signs of accumulation around the major support (~3.20–3.25).
This zone can serve as the ultimate defense for trend continuation and provide a second long opportunity with better R:R.
🧠 6. Mindset for Traders:
Don’t chase: Let price come to your level, and focus on confirmation.
Trade with the trend: Structure supports bullish movement — trade in the direction of strength.
Use proper risk management: Define SL and TP before entering. Partial profits at key resistance zones are a smart strategy.
Avoid overtrading: Wait for structural retests or confirmation candles to stay on the right side of the market.
The current TONUSDT (Toncoin/USDT) 2-hour chart exhibits a strong bullish market structure, characterized by a clear sequence of higher highs and higher lows. This confirms bullish momentum and suggests that the market is in a well-established uptrend.
The key highlight here is the "Blue Ray – Trend Continuation Pattern", which signals sustained bullish pressure following a clean breakout. This breakout was preceded by a consolidation phase, indicating accumulation by smart money before the expansion move.
🔍 2. Technical Structure and Pattern Breakdown:
🔵 Blue Ray – Trend Continuation Pattern:
This diagonal support trendline captured the initial breakout after the market bottomed near July 29–30.
Price respected this ascending line multiple times before accelerating, confirming bullish control.
Once the price broke above the previous swing high, it completed the pattern and triggered a momentum-driven rally.
🔲 Structural Zones – Major and Minor:
Minor Support Zone (~3.50 USDT):
Currently acting as short-term demand.
Price is showing early signs of rejection here, suggesting bulls may reload for a second impulsive move.
If this zone holds, we expect a new higher high to form, potentially targeting 3.80–4.00+ USDT.
Major Support Zone (~3.20–3.25 USDT):
Acts as long-term bullish defense.
In case of deeper retracement or shakeout, this is the key level to watch for possible trend continuation and re-entry.
📈 3. Structural Analysis and Price Projection:
The projected path on the chart shows a classic price action structure:
- Impulse
- Correction (toward minor support)
- Next Impulse (break of recent high)
- Higher low (continuation within trend channel)
- Potential final push toward the 3.90–4.00 range
This type of Elliott Wave-inspired behavior suggests we're in wave 3 or 5 of a bullish sequence, with minor dips offering low-risk long setups.
📊 4. Candlestick & Market Behavior:
Recent candles show long lower wicks, suggesting buyers are stepping in during dips.
Bearish candles are relatively smaller and followed by immediate bullish response.
This indicates buy-the-dip sentiment, common in a trending market.
🔄 5. Trading Plan & Scenarios:
✅ Bullish Continuation (Base Case):
Wait for a clear bullish engulfing or price bounce at the minor support zone (~3.50 USDT).
Enter with confirmation: bullish candle close, volume spike, or trendline reaction.
Targets:
TP1: 3.80 USDT
TP2: 4.00–4.10 USDT
Stop Loss: Below 3.45 (or structure-based trailing stop)
⚠️ Bearish Case / Deeper Pullback:
If 3.50 fails, look for signs of accumulation around the major support (~3.20–3.25).
This zone can serve as the ultimate defense for trend continuation and provide a second long opportunity with better R:R.
🧠 6. Mindset for Traders:
Don’t chase: Let price come to your level, and focus on confirmation.
Trade with the trend: Structure supports bullish movement — trade in the direction of strength.
Use proper risk management: Define SL and TP before entering. Partial profits at key resistance zones are a smart strategy.
Avoid overtrading: Wait for structural retests or confirmation candles to stay on the right side of the market.
For Daily Trade Setups and Forecast: 📈 t.me/xauusdoptimizer
Premium Signals Fr33: 💯 t.me/xauusdoptimizer
🥰🥳🤩
Premium Signals Fr33: 💯 t.me/xauusdoptimizer
🥰🥳🤩
Related publications
Disclaimer
The information and publications are not meant to be, and do not constitute, financial, investment, trading, or other types of advice or recommendations supplied or endorsed by TradingView. Read more in the Terms of Use.