“Blue Ray Pattern Breakout Confirms Bullish Trend Continuation”
The 30-minute chart of TONUSDT highlights a clean and structured bullish setup based on the MMC (Mirror Market Concepts) methodology. The price action exhibits disciplined market behavior, respecting structural levels, breakout dynamics, and volume-based reactions.
🔷 1. Blue Ray Pattern – Trend Continuation Phase
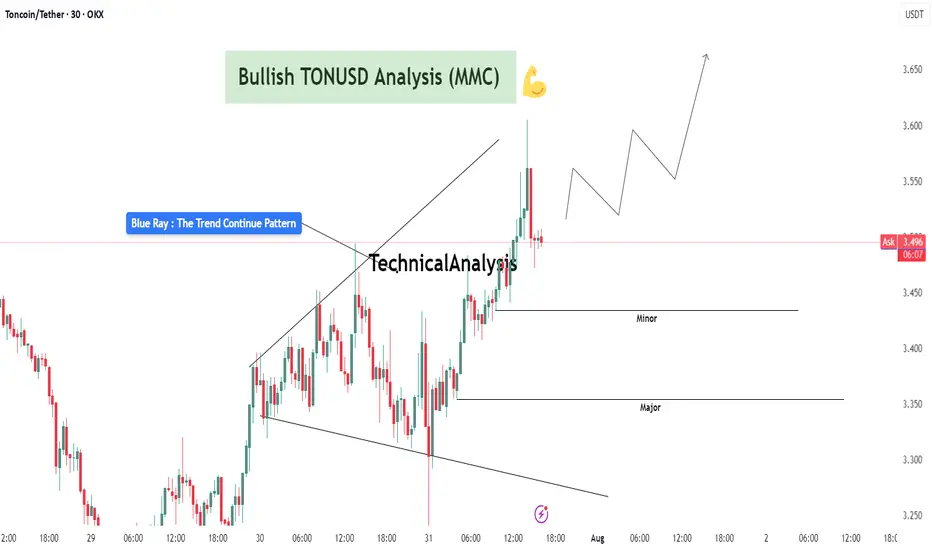
This chart begins with the formation of the Blue Ray, a visual representation of trend consolidation and energy buildup. This pattern functions as a trend continuation flag or wedge. Prices compressed within a narrowing range, forming higher lows and lower highs, signaling accumulation under buyer control.
Once the pattern matured, we witnessed a decisive bullish breakout, where the price closed above resistance with conviction. This event marked a clear market intention shift and established a new impulsive leg.
🔍 2. Breakout Confirmation and Follow-Through
Post-breakout, TONUSDT experienced:
High-volume candles with elongated bodies, indicating increased buyer participation.
Immediate upside momentum that pushed the asset into a short-term overextended condition – often a healthy sign of strength when followed by a controlled pullback.
The breakout wasn’t just a false move – it was sustained, and the price held above the broken structure, proving that supply was absorbed and buyers were dominant.
🔑 3. Demand Zones (Minor and Major)
Two key MMC demand zones are highlighted:
🔹 Minor Demand Zone (~3.43–3.45):
This is the most immediate support and current price is hovering just above it. It's the first zone of interest for buyers and may serve as a re-entry or scaling point.
🔸 Major Demand Zone (~3.34–3.36):
In case of deeper retracement or volatility, this zone is expected to act as a strong bounce region based on past structure and MMC’s reversal logic. Price memory here suggests accumulation or reactive interest.
📐 4. Structure, Momentum, and Higher Timeframe Confluence
TONUSDT is in a confirmed uptrend, forming a clear sequence of higher highs and higher lows.
The structure supports a bullish flag breakout with minimal overhead resistance.
The projected path drawn on the chart illustrates a stair-stepping price pattern with continuation toward 3.60–3.70, if current levels hold.
📊 5. MMC Strategy Bias – Bullish
Using the MMC lens:
💡 Trader’s Takeaway:
TONUSDT is providing a textbook bullish opportunity under the MMC framework. As long as price stays above the Minor Demand Zone, continuation upward toward 3.60 and beyond remains in play. If price dips to the Major Zone, watch for strong buyer reactions for fresh entries.
Ideal for MMC traders and technical analysts looking to align with structured, logic-based entries and exits. This setup reflects market strength, technical clarity, and volume confirmation – a powerful trio for continuation plays.
The 30-minute chart of TONUSDT highlights a clean and structured bullish setup based on the MMC (Mirror Market Concepts) methodology. The price action exhibits disciplined market behavior, respecting structural levels, breakout dynamics, and volume-based reactions.
🔷 1. Blue Ray Pattern – Trend Continuation Phase
This chart begins with the formation of the Blue Ray, a visual representation of trend consolidation and energy buildup. This pattern functions as a trend continuation flag or wedge. Prices compressed within a narrowing range, forming higher lows and lower highs, signaling accumulation under buyer control.
Once the pattern matured, we witnessed a decisive bullish breakout, where the price closed above resistance with conviction. This event marked a clear market intention shift and established a new impulsive leg.
🔍 2. Breakout Confirmation and Follow-Through
Post-breakout, TONUSDT experienced:
High-volume candles with elongated bodies, indicating increased buyer participation.
Immediate upside momentum that pushed the asset into a short-term overextended condition – often a healthy sign of strength when followed by a controlled pullback.
The breakout wasn’t just a false move – it was sustained, and the price held above the broken structure, proving that supply was absorbed and buyers were dominant.
🔑 3. Demand Zones (Minor and Major)
Two key MMC demand zones are highlighted:
🔹 Minor Demand Zone (~3.43–3.45):
This is the most immediate support and current price is hovering just above it. It's the first zone of interest for buyers and may serve as a re-entry or scaling point.
🔸 Major Demand Zone (~3.34–3.36):
In case of deeper retracement or volatility, this zone is expected to act as a strong bounce region based on past structure and MMC’s reversal logic. Price memory here suggests accumulation or reactive interest.
📐 4. Structure, Momentum, and Higher Timeframe Confluence
TONUSDT is in a confirmed uptrend, forming a clear sequence of higher highs and higher lows.
The structure supports a bullish flag breakout with minimal overhead resistance.
The projected path drawn on the chart illustrates a stair-stepping price pattern with continuation toward 3.60–3.70, if current levels hold.
📊 5. MMC Strategy Bias – Bullish
Using the MMC lens:
- Blue Ray breakout confirms continuation
- Volume absorption succeeded at the base of the flag
- No signs of dominant supply entering post-breakout
- Wave projection supports ongoing momentum
- Structure favors buying dips, not shorting spikes
💡 Trader’s Takeaway:
TONUSDT is providing a textbook bullish opportunity under the MMC framework. As long as price stays above the Minor Demand Zone, continuation upward toward 3.60 and beyond remains in play. If price dips to the Major Zone, watch for strong buyer reactions for fresh entries.
Ideal for MMC traders and technical analysts looking to align with structured, logic-based entries and exits. This setup reflects market strength, technical clarity, and volume confirmation – a powerful trio for continuation plays.
For Daily Trade Setups and Forecast: 📈 t.me/xauusdoptimizer
Premium Signals Fr33: 💯 t.me/xauusdoptimizer
🥰🥳🤩
Premium Signals Fr33: 💯 t.me/xauusdoptimizer
🥰🥳🤩
Related publications
Disclaimer
The information and publications are not meant to be, and do not constitute, financial, investment, trading, or other types of advice or recommendations supplied or endorsed by TradingView. Read more in the Terms of Use.