Observing the 
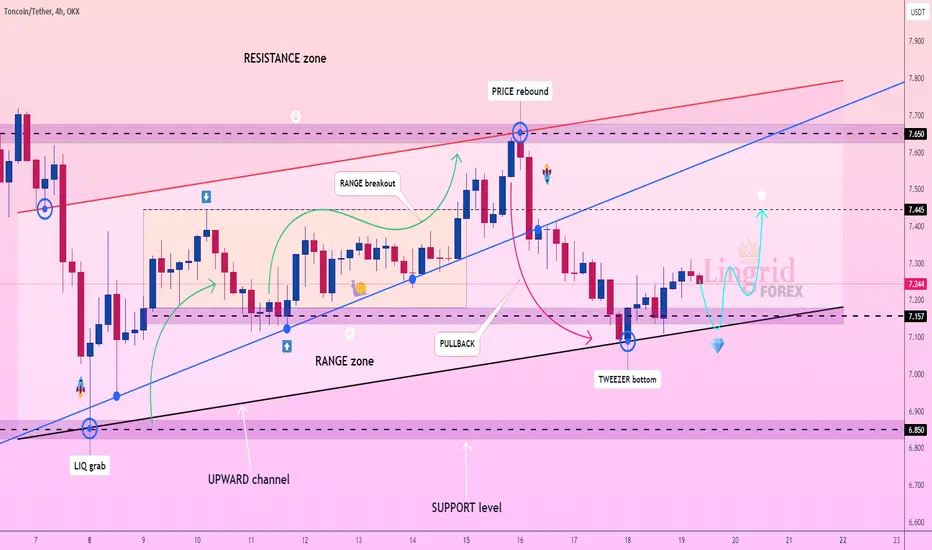
 TONUSDT, we can notice that most significant price movements tend to occur over the weekends. Recently, the price has formed a double bottom and tweezer bottom candlestick pattern, which is a bullish indication. The price has bounced off a key support level, creating an upward channel. Since the price action has been moving sideways within a range zone established at the beginning of July, I anticipate continuation of the consolidation until we see clear trend. I think that the market may pull back to the support level before reversing and moving upwards. My target is resistance zone around 7.445.
Traders, if you liked this idea or if you have your own opinion about it, write in the comments. I will be glad 👩💻
Traders, if you liked this idea or if you have your own opinion about it, write in the comments. I will be glad 👩💻
💰FREE FOREX signals in Telegram: bit.ly/3F4mrMi
🚀FREE CRYPTO signals in Telegram: t.me/cryptolingrid
🌎WebSite: lingrid.org
🚀FREE CRYPTO signals in Telegram: t.me/cryptolingrid
🌎WebSite: lingrid.org
Disclaimer
The information and publications are not meant to be, and do not constitute, financial, investment, trading, or other types of advice or recommendations supplied or endorsed by TradingView. Read more in the Terms of Use.