🔍 TON/USDT Analysis: 1-Hour Timeframe 📉
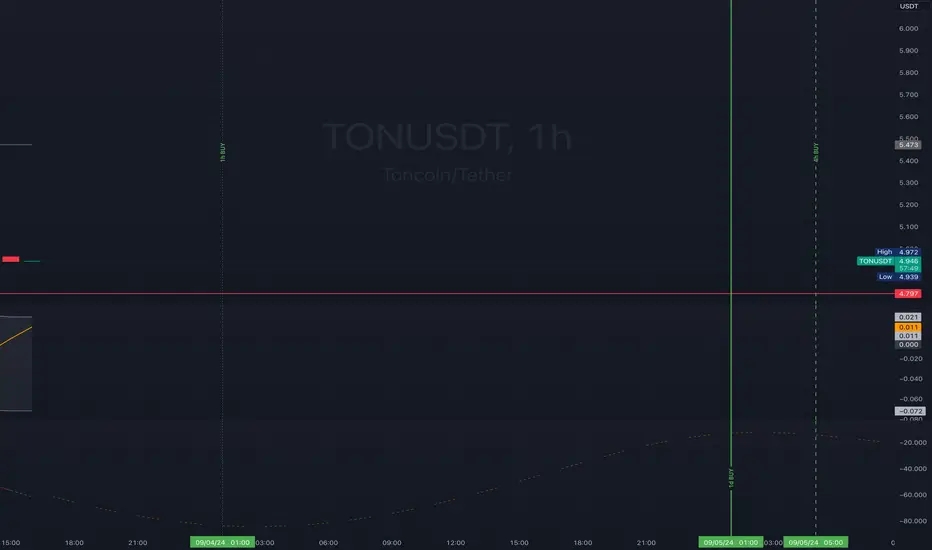
The TON/USDT chart on a 1-hour timeframe highlights significant upcoming times where price movements may present trading opportunities. It’s essential to analyze these signals in conjunction with higher timeframes for a comprehensive market view.
• BUY DATE - September 4, 2024, 01:00 - Green Line: This time indicates a potential local low, offering favorable conditions for accumulating TON or entering long positions.
• BUY DATE - September 5, 2024, 01:00 and 05:00 - Green Lines: These times suggest additional potential local lows, marking favorable conditions for considering new positions or accumulating more TON.
When working with this 1-hour timeframe, remember to evaluate these movements within the context of the broader market trend, considering higher timeframes for a more global perspective.
Note: The exact timing of these phases can vary by +/- a few hours. All times are based on UTC-7 (Los Angeles).
Yes
Disclaimer
The information and publications are not meant to be, and do not constitute, financial, investment, trading, or other types of advice or recommendations supplied or endorsed by TradingView. Read more in the Terms of Use.
Yes
Disclaimer
The information and publications are not meant to be, and do not constitute, financial, investment, trading, or other types of advice or recommendations supplied or endorsed by TradingView. Read more in the Terms of Use.