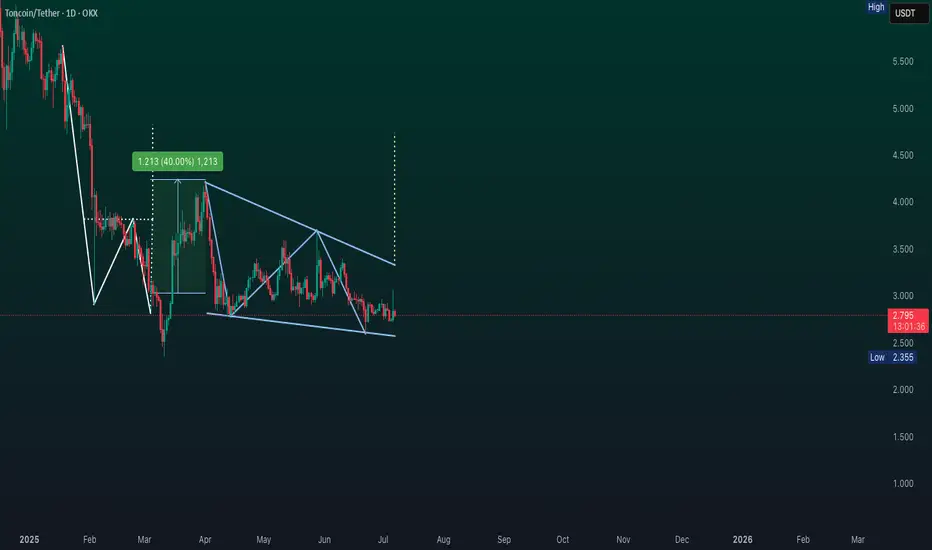
Technical Analysis: #TON/USDT 1-Day Chart shows a drop from a high of around 4.211 to a low of 2.355 recently, with a small dip (-1.69%) today. A falling wedge pattern is forming could mean a chance to bounce back
Support Zone: A strong base is at 2.600-2.789, where buyers might jump in.
Resistance Level: The next big test is at 3.091-3.265—break that, and it could rise
Falling Wedge: This pattern, with its narrowing lines, often signals a bullish move if it breaks above 3.265
Momentum: The downtrend had steady volume, but the pattern hints at a possible upturn.
Timeframe:Watch the next few days for the wedge to break out.
Possibilities:
Bullish Move: A jump above 3.265 with good volume could push it to 3.600 or more!
Bearish Drop: A fall below 2.789 might take it back to 2.355—stay careful!
Safety Tip: Set a stop-loss below 2.789 to stay safe.
Disclaimer
The information and publications are not meant to be, and do not constitute, financial, investment, trading, or other types of advice or recommendations supplied or endorsed by TradingView. Read more in the Terms of Use.
Disclaimer
The information and publications are not meant to be, and do not constitute, financial, investment, trading, or other types of advice or recommendations supplied or endorsed by TradingView. Read more in the Terms of Use.