----- Weekly chart -----
-Fast Turtle Sell triggered
=FiFT positive but OB
+ATOM still a BUY.
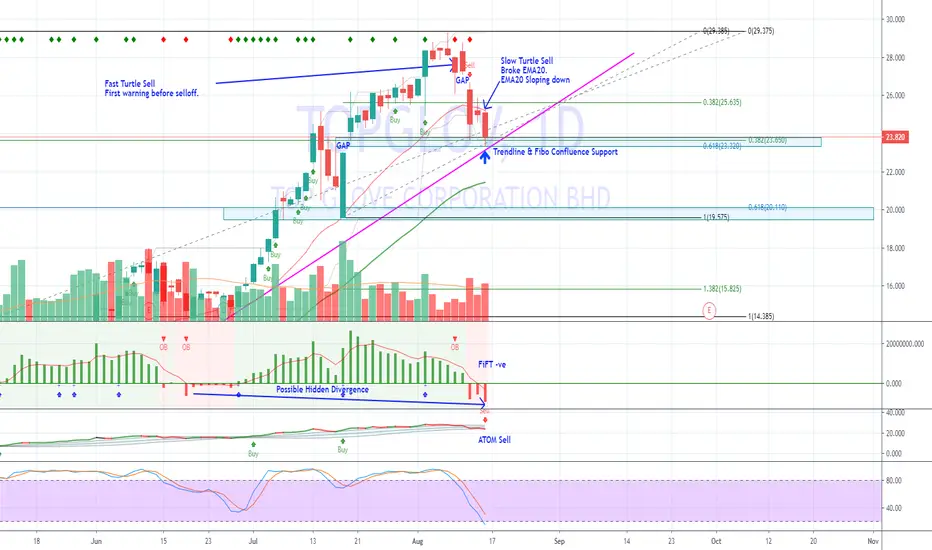
----- Daily chart -----
- First warning -> Fast Turtle Sell on 10 Aug
- Second warning -> Slow Turtle Sell on 12 Aug and FiFT turned -ve.
- Third warning -> 12 Aug Gap down remain open.
- Broke EMA20 and sloping down.
- Bear is closing previous bullish gap up.
- FiFT turned -ve, FiFT are also -ve on H4, H1, M30 timeframe.. No sign of reversal YET.
+ Sign of Hidden Bullish Divergence if TG able to bounce from current support level (23.3 to 23.7)
+ Still above EMA50
- ATOM sell.
----- Summary -----
Bearish sentiment.
TG is at Trendline and Key Fibo Support Levels (23.3 to 23.7).
Break these support will expose to next major Support at 21.5 (EMA50) and 19.5.
Plan to revisit if FiFT Bar > FiFT MA.
-Fast Turtle Sell triggered
=FiFT positive but OB
+ATOM still a BUY.
----- Daily chart -----
- First warning -> Fast Turtle Sell on 10 Aug
- Second warning -> Slow Turtle Sell on 12 Aug and FiFT turned -ve.
- Third warning -> 12 Aug Gap down remain open.
- Broke EMA20 and sloping down.
- Bear is closing previous bullish gap up.
- FiFT turned -ve, FiFT are also -ve on H4, H1, M30 timeframe.. No sign of reversal YET.
+ Sign of Hidden Bullish Divergence if TG able to bounce from current support level (23.3 to 23.7)
+ Still above EMA50
- ATOM sell.
----- Summary -----
Bearish sentiment.
TG is at Trendline and Key Fibo Support Levels (23.3 to 23.7).
Break these support will expose to next major Support at 21.5 (EMA50) and 19.5.
Plan to revisit if FiFT Bar > FiFT MA.
Note
Bounce from EMA50 (21.5)
Note
Hourly chart FiFT Turned +ve with BoD
Second bounce from EMA50 21.5 zone
Note
Opportunity to buy
Note
Lower timeframe double bottom formed at BoD Zone
M30 FiFT turned +ve, Can H1 turned +ve ?
Confluence Resistance area 29, 32, 33
Note
TG showing characteristic of Wave 4 completion.
Ended with Wave C with oversold and selling climax situation.
It is also bounce from Resistance turned Support from peak of Wave 1 and form Bullish Engulfing reversal candle confirmed byGAP up candle which remain open.
FiFT also shows BoD with STAR signal and Slow Turtle BUY.
Expect TopGlov to continue to rally after BULL-BEAR fight at 8.4
Next resistance is around 9.3
Contact me to learn Turtle Trading System, MCDX and other indicators (t.me/SgxFx)
tradingview.com/script/mbiUr95n-MCDX-Plus/
tradingview.com/script/mcAidXIT-FiFT-Pro/
tradingview.com/script/viAR3Ilo-Trend-Sign
tradingview.com/script/mbiUr95n-MCDX-Plus/
tradingview.com/script/mcAidXIT-FiFT-Pro/
tradingview.com/script/viAR3Ilo-Trend-Sign
Disclaimer
The information and publications are not meant to be, and do not constitute, financial, investment, trading, or other types of advice or recommendations supplied or endorsed by TradingView. Read more in the Terms of Use.