Executive Summary
This analysis examines price data for the top 10 cryptocurrencies by market capitalization (BTC, ETH, BNB, SOL, ADA, XRP, TRX, USDT, USDC, DOGE) . The inclusion of stable coins (USDT, USDC) and meme coins (DOGE) provides a more complete picture of capital flows within the cryptocurrency ecosystem. The data reveals significant market trends, correlation patterns, and potential future price targets based on historical performance.
Market Overview
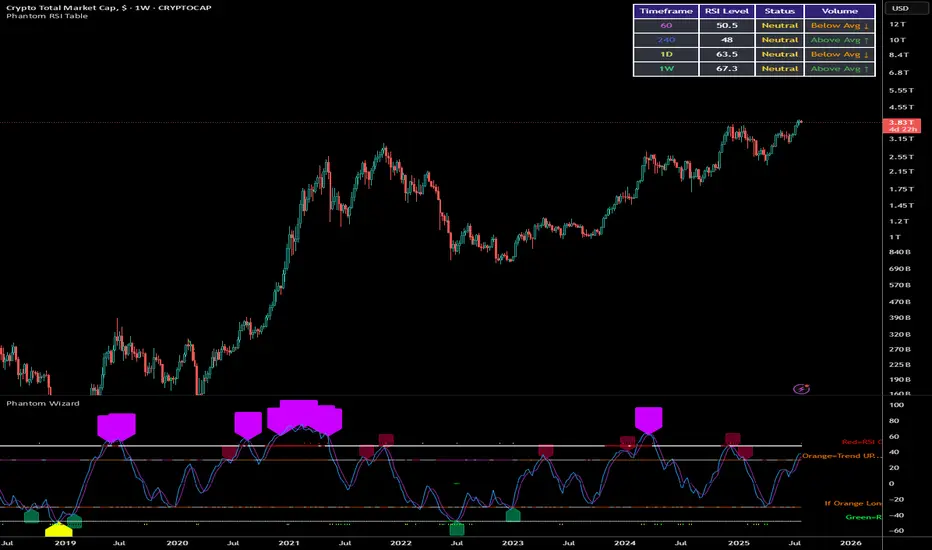
The total cryptocurrency market capitalization grew from approximately $2.06 trillion in July 2024 to $3.82 trillion by July 2025, representing an 85% increase. During this period, we observed several notable market-wide movements:
Major Growth Phase (October-November 2024): The market experienced substantial growth, with Total Market Cap increasing from $2.47T to $3.57T.
Market Correction (January 2025): A significant correction occurred with the Total Market Cap dropping to $2.81T, representing a 21% decline from its peak.
Recovery and Stabilization (February-July 2025): The market recovered and stabilized, reaching new highs around $3.82T by July 2025.
Stable coin Analysis
USDT (Tether)
Market Cap Range: $119.6B to $163.7B (July 2024 - July 2025)
Overall Growth: 36.9%
Key Insight: USDT's market cap grew steadily throughout the period, with accelerated growth during market uptrends, indicating increased demand for trading liquidity.
Correlation with Market Movements: USDT market cap expansion typically preceded major market rallies, suggesting capital inflows preparing to enter volatile assets.
USDC (USD Coin)
Market Cap Range: $34.7B to $65.1B (July 2024 - July 2025)
Overall Growth: 87.6%
Key Insight: USDC showed stronger percentage growth than USDT, potentially indicating institutional preference for this stable coin.
Usage Pattern: USDC market cap showed notable increases in October 2024 and April-May 2025, coinciding with periods of market volatility.
Combined Stable coin Impact
Total stable coin market cap (USDT + USDC) grew from approximately $154.3B to $228.8B, a 48.3% increase.
This growth suggests significant new capital entered the cryptocurrency ecosystem during this period.
The ratio of stable coin market cap to total market cap decreased slightly from 7.5% to 6.0%, indicating that volatile assets grew at a faster rate than stable coins.
Individual Volatile Asset Performance
Bitcoin (BTC)
Price Range: $60,459 to $120,998 (July 2024 - July 2025)
Overall Growth: 94.2%
Key Support Zones: $80,000-$84,000, $95,000-$97,000, $103,000-$105,000
Key Resistance Zones: $120,000-$122,000, $130,000-$135,000
Future Target: Based on established support levels and growth trajectory, BTC could target the $125,000-$135,000 range in the next cycle, with potential for $150,000 if market conditions remain favourable.
Ethereum (ETH)
Price Range: $2,330 to $3,941 (July 2024 - July 2025)
Overall Growth: 57.8%
Key Support Zones: $2,800-$3,000, $3,200-$3,300, $3,500-$3,600
Key Resistance Zones: $4,000-$4,100, $4,500-$4,700
Future Target: ETH could target the $4,200-$4,800 range, with potential for $5,500 if it breaks historical resistance levels.
Finance Coin (BNB)
Price Range: $544 to $861 (July 2024 - July 2025)
Overall Growth: 45.7%
Key Support Zones: $650-$680, $720-$750, $800-$820
Key Resistance Zones: $860-$880, $900-$950
Future Target: BNB could reach $900-$1,000 based on its established support levels and growth patterns.
Solana (SOL)
Price Range: $135.52 to $224 (July 2024 - July 2025)
Overall Growth: 33.8%
Key Support Zones: $140-$150, $175-$185, $200-$210
Key Resistance Zones: $220-$230, $250-$270
Future Target: SOL could target $230-$280 range if market conditions remain favourable.
Cardano (ADA)
Price Range: $0.3315 to $1.3264 (July 2024 - July 2025)
Overall Growth: 136.7%
Key Support Zones: $0.70-$0.75, $0.85-$0.90, $1.05-$1.10
Key Resistance Zones: $1.30-$1.35, $1.50-$1.60
Future Target: ADA could target $1.40-$1.80 based on its growth trajectory and previous resistance levels.
XRP
Price Range: $0.486 to $3.6607 (July 2024 - July 2025)
Overall Growth: 501.1%
Key Support Zones: $2.00-$2.20, $2.50-$2.70, $3.00-$3.20
Key Resistance Zones: $3.60-$3.80, $4.00-$4.50
Future Target: XRP could target $3.80-$4.50 if its growth momentum continues.
TRON (TRX)
Price Range: $0.1531 to $0.351 (July 2024 - July 2025)
Overall Growth: 104.4%
Key Support Zones: $0.25-$0.27, $0.30-$0.32
Key Resistance Zones: $0.35-$0.37, $0.40-$0.42
Future Target: TRX could target $0.36-$0.45 based on its established growth pattern.
Dogecoin (DOGE)
Price Range: $0.10311 to $0.48 (July 2024 - July 2025)
Overall Growth: 117.9%
Key Support Zones: $0.16-$0.18, $0.20-$0.22, $0.25-$0.27
Key Resistance Zones: $0.40-$0.45, $0.50-$0.55
Future Target: DOGE could target $0.45-$0.60 during the next market cycle, with potential for higher spikes based on its historical volatility patterns.
Market Capitalization Analysis
Total Market Cap vs. Total Market Cap 3 (Excluding BTC and ETH)
Total Market Cap: Increased from $2.06T to $3.82T (+85%)
Total Market Cap 3: Increased from $579B to $1.01T (+74.4%)
This comparison reveals that BTC and ETH slightly outperformed the broader altcoin market in percentage terms, suggesting a preference for established cryptocurrencies during this period.
Capital Flow Analysis
Stable coin to Volatile Asset Flow:
The data shows clear patterns of capital moving from stable coins to volatile assets during bullish phases.
USDT market cap growth often preceded major market rallies by 2-4 weeks, suggesting accumulation phases.
USDC showed more pronounced growth during institutional adoption phases, particularly in Q4 2024.
Bitcoin Dominance Trend:
Bitcoin maintained or slightly increased its market share relative to altcoins.
During market corrections (particularly January 2025), capital flowed from altcoins to BTC, reinforcing its status as a "crypto safe haven."
Altcoin Rotation:
Clear evidence of capital rotation among altcoins, with ADA, XRP, and DOGE experiencing periods of significant outperformance.
SOL showed high correlation with overall market sentiment, amplifying both upward and downward movements.
DOGE experienced significant volatility, with its price movements often lagging BTC rallies but showing stronger percentage gains during peak market euphoria.
Meme Coin Impact:
DOGE's market cap fluctuated between $13.8B and $33.8B, representing a significant but volatile portion of the market.
DOGE price movements often signalled market cycle extremes, with major rallies in DOGE coinciding with broader market tops.
Correlation Analysis
High Correlation Assets: BTC, ETH, and Total Market Cap showed the strongest correlations (>0.9), indicating that these assets move largely in tandem.
Moderate Correlation Assets: BNB, SOL, and ADA showed moderate correlations with BTC (0.7-0.85), suggesting they follow broader market trends but with greater independent movement.
Lower Correlation Assets: XRP, TRX, and DOGE showed the lowest correlations with BTC (<0.7), indicating more independent price action potentially driven by project-specific factors or retail sentiment.
Stable coin Correlations: USDT and USDC market caps showed weak negative correlation with volatile asset prices during extreme market movements, confirming their role as counter-cyclical safe havens.
Price Zone Analysis and Future Targets
Bitcoin (BTC)
Current Support Zones: $103,000-$105,000, $95,000-$97,000
Current Resistance Zones: $120,000-$122,000
Future Target Zones: $125,000-$135,000 (primary), $150,000-$160,000 (extended)
Key Insight: BTC has established strong support around the $100,000 psychological level, which could serve as a foundation for future growth.
Ethereum (ETH)
Current Support Zones: $3,500-$3,600, $3,200-$3,300
Current Resistance Zones: $4,000-$4,100
Future Target Zones: $4,200-$4,800 (primary), $5,000-$5,500 (extended)
Key Insight: ETH needs to decisively break the $4,000 level to confirm its next major uptrend.
Binance Coin (BNB)
Current Support Zones: $800-$820, $720-$750
Current Resistance Zones: $860-$880
Future Target Zones: $900-$1,000 (primary), $1,100-$1,200 (extended)
Key Insight: BNB has shown resilience during market corrections, suggesting strong holder conviction.
Solana (SOL)
Current Support Zones: $175-$185, $150-$160
Current Resistance Zones: $220-$230
Future Target Zones: $230-$280 (primary), $300-$350 (extended)
Key Insight: SOL's volatility makes it susceptible to sharp corrections but also enables rapid recoveries.
Cardano (ADA)
Current Support Zones: $0.85-$0.90, $0.70-$0.75
Current Resistance Zones: $1.30-$1.35
Future Target Zones: $1.40-$1.80 (primary), $2.00-$2.20 (extended)
Key Insight: ADA has shown strong percentage growth from its lows, suggesting potential for continued outperformance.
XRP
Current Support Zones: $3.00-$3.20, $2.50-$2.70
Current Resistance Zones: $3.60-$3.80
Future Target Zones: $3.80-$4.50 (primary), $5.00-$5.50 (extended)
Key Insight: XRP's price action appears heavily influenced by regulatory developments, making it more unpredictable than other assets.
TRON (TRX)
Current Support Zones: $0.30-$0.32, $0.25-$0.27
Current Resistance Zones: $0.35-$0.37
Future Target Zones: $0.36-$0.45 (primary), $0.50-$0.55 (extended)
Key Insight: TRX has shown steady growth with lower volatility compared to other altcoins.
Dogecoin (DOGE)
Current Support Zones: $0.20-$0.22, $0.16-$0.18
Current Resistance Zones: $0.40-$0.45
Future Target Zones: $0.45-$0.60 (primary), $0.70-$0.80 (extended)
Key Insight: DOGE price movements often signal retail sentiment and can be leading indicators for market cycle extremes.
Future Outlook
Based on the comprehensive data analysis, several key trends may continue:
Bitcoin's Continued Dominance: BTC is likely to maintain its position as the market leader, with potential targets in the $125,000-$135,000 range in the near term, and possibility of $150,000-$160,000 in an extended bull market.
Stablecoin Growth: The continued expansion of stablecoin market caps suggests ongoing new capital inflows to the cryptocurrency ecosystem, which could fuel further price appreciation across volatile assets.
Altcoin Selectivity: The data suggests increasing selectivity in altcoin performance, with projects like ADA, XRP, and SOL showing potential for continued outperformance based on their specific adoption metrics.
Meme Coin Volatility: DOGE and similar assets may continue to experience extreme volatility, with their performance often signaling market cycle extremes.
Market Maturation: The overall market shows signs of maturation, with less extreme volatility in established assets compared to previous market cycles, suggesting growing institutional involvement.
Conclusion
The cryptocurrency market from July 2024 to July 2025 demonstrated significant growth with varying performance across assets. Bitcoin maintained its dominance while select altcoins showed remarkable growth. The inclusion of stablecoins in the analysis reveals important capital flow patterns that help explain market movements.
The data suggests a maturing market with increasing differentiation between assets based on their fundamental value propositions and adoption metrics. Stablecoins continue to play a crucial role in providing liquidity and serving as temporary safe havens during market volatility.
Future price targets should be considered in the context of broader market conditions, regulatory developments, and technological advancements that could significantly impact individual asset performance. The identified support and resistance zones provide valuable reference points for potential entry and exit levels.
This analysis examines price data for the top 10 cryptocurrencies by market capitalization (BTC, ETH, BNB, SOL, ADA, XRP, TRX, USDT, USDC, DOGE) . The inclusion of stable coins (USDT, USDC) and meme coins (DOGE) provides a more complete picture of capital flows within the cryptocurrency ecosystem. The data reveals significant market trends, correlation patterns, and potential future price targets based on historical performance.
Market Overview
The total cryptocurrency market capitalization grew from approximately $2.06 trillion in July 2024 to $3.82 trillion by July 2025, representing an 85% increase. During this period, we observed several notable market-wide movements:
Major Growth Phase (October-November 2024): The market experienced substantial growth, with Total Market Cap increasing from $2.47T to $3.57T.
Market Correction (January 2025): A significant correction occurred with the Total Market Cap dropping to $2.81T, representing a 21% decline from its peak.
Recovery and Stabilization (February-July 2025): The market recovered and stabilized, reaching new highs around $3.82T by July 2025.
Stable coin Analysis
USDT (Tether)
Market Cap Range: $119.6B to $163.7B (July 2024 - July 2025)
Overall Growth: 36.9%
Key Insight: USDT's market cap grew steadily throughout the period, with accelerated growth during market uptrends, indicating increased demand for trading liquidity.
Correlation with Market Movements: USDT market cap expansion typically preceded major market rallies, suggesting capital inflows preparing to enter volatile assets.
USDC (USD Coin)
Market Cap Range: $34.7B to $65.1B (July 2024 - July 2025)
Overall Growth: 87.6%
Key Insight: USDC showed stronger percentage growth than USDT, potentially indicating institutional preference for this stable coin.
Usage Pattern: USDC market cap showed notable increases in October 2024 and April-May 2025, coinciding with periods of market volatility.
Combined Stable coin Impact
Total stable coin market cap (USDT + USDC) grew from approximately $154.3B to $228.8B, a 48.3% increase.
This growth suggests significant new capital entered the cryptocurrency ecosystem during this period.
The ratio of stable coin market cap to total market cap decreased slightly from 7.5% to 6.0%, indicating that volatile assets grew at a faster rate than stable coins.
Individual Volatile Asset Performance
Bitcoin (BTC)
Price Range: $60,459 to $120,998 (July 2024 - July 2025)
Overall Growth: 94.2%
Key Support Zones: $80,000-$84,000, $95,000-$97,000, $103,000-$105,000
Key Resistance Zones: $120,000-$122,000, $130,000-$135,000
Future Target: Based on established support levels and growth trajectory, BTC could target the $125,000-$135,000 range in the next cycle, with potential for $150,000 if market conditions remain favourable.
Ethereum (ETH)
Price Range: $2,330 to $3,941 (July 2024 - July 2025)
Overall Growth: 57.8%
Key Support Zones: $2,800-$3,000, $3,200-$3,300, $3,500-$3,600
Key Resistance Zones: $4,000-$4,100, $4,500-$4,700
Future Target: ETH could target the $4,200-$4,800 range, with potential for $5,500 if it breaks historical resistance levels.
Finance Coin (BNB)
Price Range: $544 to $861 (July 2024 - July 2025)
Overall Growth: 45.7%
Key Support Zones: $650-$680, $720-$750, $800-$820
Key Resistance Zones: $860-$880, $900-$950
Future Target: BNB could reach $900-$1,000 based on its established support levels and growth patterns.
Solana (SOL)
Price Range: $135.52 to $224 (July 2024 - July 2025)
Overall Growth: 33.8%
Key Support Zones: $140-$150, $175-$185, $200-$210
Key Resistance Zones: $220-$230, $250-$270
Future Target: SOL could target $230-$280 range if market conditions remain favourable.
Cardano (ADA)
Price Range: $0.3315 to $1.3264 (July 2024 - July 2025)
Overall Growth: 136.7%
Key Support Zones: $0.70-$0.75, $0.85-$0.90, $1.05-$1.10
Key Resistance Zones: $1.30-$1.35, $1.50-$1.60
Future Target: ADA could target $1.40-$1.80 based on its growth trajectory and previous resistance levels.
XRP
Price Range: $0.486 to $3.6607 (July 2024 - July 2025)
Overall Growth: 501.1%
Key Support Zones: $2.00-$2.20, $2.50-$2.70, $3.00-$3.20
Key Resistance Zones: $3.60-$3.80, $4.00-$4.50
Future Target: XRP could target $3.80-$4.50 if its growth momentum continues.
TRON (TRX)
Price Range: $0.1531 to $0.351 (July 2024 - July 2025)
Overall Growth: 104.4%
Key Support Zones: $0.25-$0.27, $0.30-$0.32
Key Resistance Zones: $0.35-$0.37, $0.40-$0.42
Future Target: TRX could target $0.36-$0.45 based on its established growth pattern.
Dogecoin (DOGE)
Price Range: $0.10311 to $0.48 (July 2024 - July 2025)
Overall Growth: 117.9%
Key Support Zones: $0.16-$0.18, $0.20-$0.22, $0.25-$0.27
Key Resistance Zones: $0.40-$0.45, $0.50-$0.55
Future Target: DOGE could target $0.45-$0.60 during the next market cycle, with potential for higher spikes based on its historical volatility patterns.
Market Capitalization Analysis
Total Market Cap vs. Total Market Cap 3 (Excluding BTC and ETH)
Total Market Cap: Increased from $2.06T to $3.82T (+85%)
Total Market Cap 3: Increased from $579B to $1.01T (+74.4%)
This comparison reveals that BTC and ETH slightly outperformed the broader altcoin market in percentage terms, suggesting a preference for established cryptocurrencies during this period.
Capital Flow Analysis
Stable coin to Volatile Asset Flow:
The data shows clear patterns of capital moving from stable coins to volatile assets during bullish phases.
USDT market cap growth often preceded major market rallies by 2-4 weeks, suggesting accumulation phases.
USDC showed more pronounced growth during institutional adoption phases, particularly in Q4 2024.
Bitcoin Dominance Trend:
Bitcoin maintained or slightly increased its market share relative to altcoins.
During market corrections (particularly January 2025), capital flowed from altcoins to BTC, reinforcing its status as a "crypto safe haven."
Altcoin Rotation:
Clear evidence of capital rotation among altcoins, with ADA, XRP, and DOGE experiencing periods of significant outperformance.
SOL showed high correlation with overall market sentiment, amplifying both upward and downward movements.
DOGE experienced significant volatility, with its price movements often lagging BTC rallies but showing stronger percentage gains during peak market euphoria.
Meme Coin Impact:
DOGE's market cap fluctuated between $13.8B and $33.8B, representing a significant but volatile portion of the market.
DOGE price movements often signalled market cycle extremes, with major rallies in DOGE coinciding with broader market tops.
Correlation Analysis
High Correlation Assets: BTC, ETH, and Total Market Cap showed the strongest correlations (>0.9), indicating that these assets move largely in tandem.
Moderate Correlation Assets: BNB, SOL, and ADA showed moderate correlations with BTC (0.7-0.85), suggesting they follow broader market trends but with greater independent movement.
Lower Correlation Assets: XRP, TRX, and DOGE showed the lowest correlations with BTC (<0.7), indicating more independent price action potentially driven by project-specific factors or retail sentiment.
Stable coin Correlations: USDT and USDC market caps showed weak negative correlation with volatile asset prices during extreme market movements, confirming their role as counter-cyclical safe havens.
Price Zone Analysis and Future Targets
Bitcoin (BTC)
Current Support Zones: $103,000-$105,000, $95,000-$97,000
Current Resistance Zones: $120,000-$122,000
Future Target Zones: $125,000-$135,000 (primary), $150,000-$160,000 (extended)
Key Insight: BTC has established strong support around the $100,000 psychological level, which could serve as a foundation for future growth.
Ethereum (ETH)
Current Support Zones: $3,500-$3,600, $3,200-$3,300
Current Resistance Zones: $4,000-$4,100
Future Target Zones: $4,200-$4,800 (primary), $5,000-$5,500 (extended)
Key Insight: ETH needs to decisively break the $4,000 level to confirm its next major uptrend.
Binance Coin (BNB)
Current Support Zones: $800-$820, $720-$750
Current Resistance Zones: $860-$880
Future Target Zones: $900-$1,000 (primary), $1,100-$1,200 (extended)
Key Insight: BNB has shown resilience during market corrections, suggesting strong holder conviction.
Solana (SOL)
Current Support Zones: $175-$185, $150-$160
Current Resistance Zones: $220-$230
Future Target Zones: $230-$280 (primary), $300-$350 (extended)
Key Insight: SOL's volatility makes it susceptible to sharp corrections but also enables rapid recoveries.
Cardano (ADA)
Current Support Zones: $0.85-$0.90, $0.70-$0.75
Current Resistance Zones: $1.30-$1.35
Future Target Zones: $1.40-$1.80 (primary), $2.00-$2.20 (extended)
Key Insight: ADA has shown strong percentage growth from its lows, suggesting potential for continued outperformance.
XRP
Current Support Zones: $3.00-$3.20, $2.50-$2.70
Current Resistance Zones: $3.60-$3.80
Future Target Zones: $3.80-$4.50 (primary), $5.00-$5.50 (extended)
Key Insight: XRP's price action appears heavily influenced by regulatory developments, making it more unpredictable than other assets.
TRON (TRX)
Current Support Zones: $0.30-$0.32, $0.25-$0.27
Current Resistance Zones: $0.35-$0.37
Future Target Zones: $0.36-$0.45 (primary), $0.50-$0.55 (extended)
Key Insight: TRX has shown steady growth with lower volatility compared to other altcoins.
Dogecoin (DOGE)
Current Support Zones: $0.20-$0.22, $0.16-$0.18
Current Resistance Zones: $0.40-$0.45
Future Target Zones: $0.45-$0.60 (primary), $0.70-$0.80 (extended)
Key Insight: DOGE price movements often signal retail sentiment and can be leading indicators for market cycle extremes.
Future Outlook
Based on the comprehensive data analysis, several key trends may continue:
Bitcoin's Continued Dominance: BTC is likely to maintain its position as the market leader, with potential targets in the $125,000-$135,000 range in the near term, and possibility of $150,000-$160,000 in an extended bull market.
Stablecoin Growth: The continued expansion of stablecoin market caps suggests ongoing new capital inflows to the cryptocurrency ecosystem, which could fuel further price appreciation across volatile assets.
Altcoin Selectivity: The data suggests increasing selectivity in altcoin performance, with projects like ADA, XRP, and SOL showing potential for continued outperformance based on their specific adoption metrics.
Meme Coin Volatility: DOGE and similar assets may continue to experience extreme volatility, with their performance often signaling market cycle extremes.
Market Maturation: The overall market shows signs of maturation, with less extreme volatility in established assets compared to previous market cycles, suggesting growing institutional involvement.
Conclusion
The cryptocurrency market from July 2024 to July 2025 demonstrated significant growth with varying performance across assets. Bitcoin maintained its dominance while select altcoins showed remarkable growth. The inclusion of stablecoins in the analysis reveals important capital flow patterns that help explain market movements.
The data suggests a maturing market with increasing differentiation between assets based on their fundamental value propositions and adoption metrics. Stablecoins continue to play a crucial role in providing liquidity and serving as temporary safe havens during market volatility.
Future price targets should be considered in the context of broader market conditions, regulatory developments, and technological advancements that could significantly impact individual asset performance. The identified support and resistance zones provide valuable reference points for potential entry and exit levels.
Discord.gg/CryptoIndicators
Disclaimer
The information and publications are not meant to be, and do not constitute, financial, investment, trading, or other types of advice or recommendations supplied or endorsed by TradingView. Read more in the Terms of Use.
Discord.gg/CryptoIndicators
Disclaimer
The information and publications are not meant to be, and do not constitute, financial, investment, trading, or other types of advice or recommendations supplied or endorsed by TradingView. Read more in the Terms of Use.