And how on earth do we reach that point?
Is Raoul's thesis regarding the exponential age accurate, suggesting we have until 2030 to invest and reap the benefits; so "don't FCK this up!"
As a charting enthusiast, I am eager to see if there exists a technical foundation that could allow us to teleport to those levels and estimate how many years it might take.
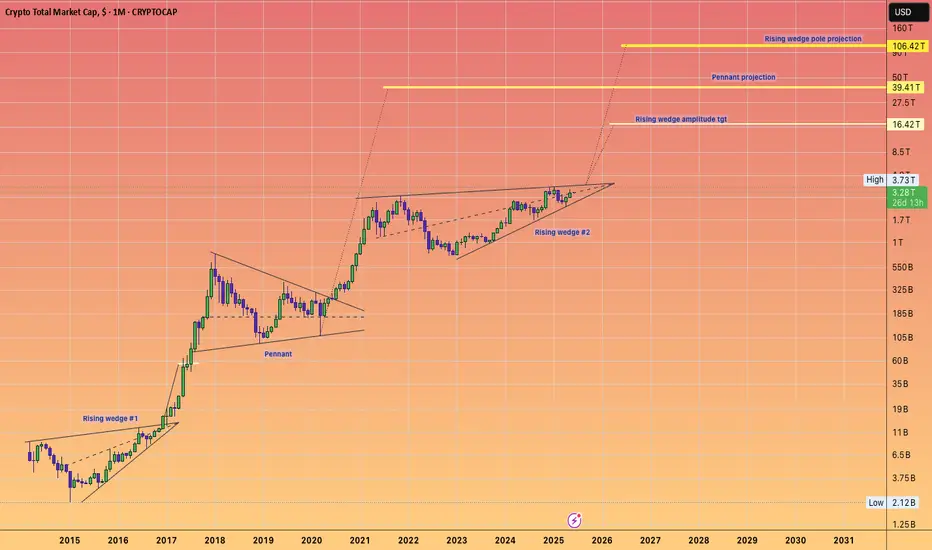
Let's examine the entire crypto market, which includes everything from stable coins to tangible real world assets like Gold.
We can distinctly identify three significant consolidation patterns.
Rising wedge #1
a sideways pennant
rising pennant #2
Now, considering this is a logarithmic chart.
It provides us with logarithmic amplitudes and projections.
An amplitude is a calculated move based on the boundaries of the consolidation pattern.
Essentially, it involves taking the top and bottom width and applying it to the breakout point for a rising pattern.
In a #HVF, we utilise the midline of the funnel to forecast targets.
The projections illustrated on this chart pertain to the sideways pennant, employing the flagpole to establish our target.
It is this sideways pennant pole projection that leads us to 100 trillion dollars and beyond. Test it out for yourself if you find it hard to believe these figures could become a reality :)
So there we have it; yes, 100 trillion dollars may appear excessively optimistic and fantastical, especially since we are currently at 3.28 trillion dollars.
However, the charts indicate that Crypto could indeed be the sector where the majority of financial transactions take place in the forthcoming exponential future.
Is Raoul's thesis regarding the exponential age accurate, suggesting we have until 2030 to invest and reap the benefits; so "don't FCK this up!"
As a charting enthusiast, I am eager to see if there exists a technical foundation that could allow us to teleport to those levels and estimate how many years it might take.
Let's examine the entire crypto market, which includes everything from stable coins to tangible real world assets like Gold.
We can distinctly identify three significant consolidation patterns.
Rising wedge #1
a sideways pennant
rising pennant #2
Now, considering this is a logarithmic chart.
It provides us with logarithmic amplitudes and projections.
An amplitude is a calculated move based on the boundaries of the consolidation pattern.
Essentially, it involves taking the top and bottom width and applying it to the breakout point for a rising pattern.
In a #HVF, we utilise the midline of the funnel to forecast targets.
The projections illustrated on this chart pertain to the sideways pennant, employing the flagpole to establish our target.
It is this sideways pennant pole projection that leads us to 100 trillion dollars and beyond. Test it out for yourself if you find it hard to believe these figures could become a reality :)
So there we have it; yes, 100 trillion dollars may appear excessively optimistic and fantastical, especially since we are currently at 3.28 trillion dollars.
However, the charts indicate that Crypto could indeed be the sector where the majority of financial transactions take place in the forthcoming exponential future.
Note
#RAOULPAL#TOTAL #CRYPTO #MARKETCAP
Disclaimer
The information and publications are not meant to be, and do not constitute, financial, investment, trading, or other types of advice or recommendations supplied or endorsed by TradingView. Read more in the Terms of Use.
Disclaimer
The information and publications are not meant to be, and do not constitute, financial, investment, trading, or other types of advice or recommendations supplied or endorsed by TradingView. Read more in the Terms of Use.