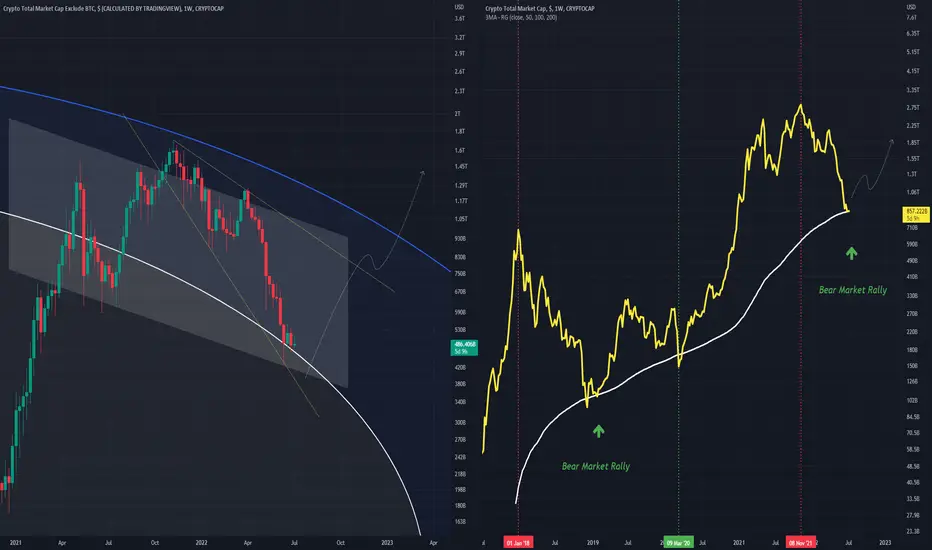
Two charts for the TOTALMCAP, on the left excludes BTC
The left chart shows a bottom along 3.618, this may cause a breakout that coincides with a bear market rally
The right further shows this with vertical lines representing bull market and bear market periods, we are currently at the bear market rally stage
This aligns also with the 200MA which should also hodl
Disclaimer
The information and publications are not meant to be, and do not constitute, financial, investment, trading, or other types of advice or recommendations supplied or endorsed by TradingView. Read more in the Terms of Use.
Disclaimer
The information and publications are not meant to be, and do not constitute, financial, investment, trading, or other types of advice or recommendations supplied or endorsed by TradingView. Read more in the Terms of Use.