GM gents, most people in crypto circles (Crypto Twitter sphere of influence and former Tradingview posters who evolved into influencers there) seem to have the consensus view that the market has little time to rise from here, and appear to signal a wall of worry sentiment.
This resonates with variables observed in Pendle Finance implied vs realized yields for many stablecoins (trading below current yield signals that people are pessimistic), for example.
The chart signals I show here clash with people's meme/beliefs about market cycles duration (most think there are fixed time cycles that accurately predict bullish and bearish trends in BTC and also the timing for altcoins to outperform Bitcoin, a ridiculous notion).
What actually happens is that there are cycles of boom and bust as a feature of the fiat currency paradigm and capitalism the way we know it, which in turn cause the bullish and bearish trends in Bitcoin and Altcoins. Market data supports the idea that trends have some correlation with periods of consolidation (what Timemode patterns show) and the importance of not forcing arbitrary parameters or beliefs into the market, as it is an affair destined for failure (a sin very common in different degrees of market specialization: going from people spotting some pattern in hindsight obvious enough for them to develop a belief and market adage, to the quant systems trader figuring out how to trade the past well in backtests by curve fitting their algorithm with a specific data sample, to then fail in real trading of the present and future).
In short: expect the unexpected regarding time cycles, fixed time cycles don't work, and better obtain data from new market information to adjust your views as time goes by, if you make a prediction, verify it with post-pattern behavior to determine if it's still valid else your results will suck.
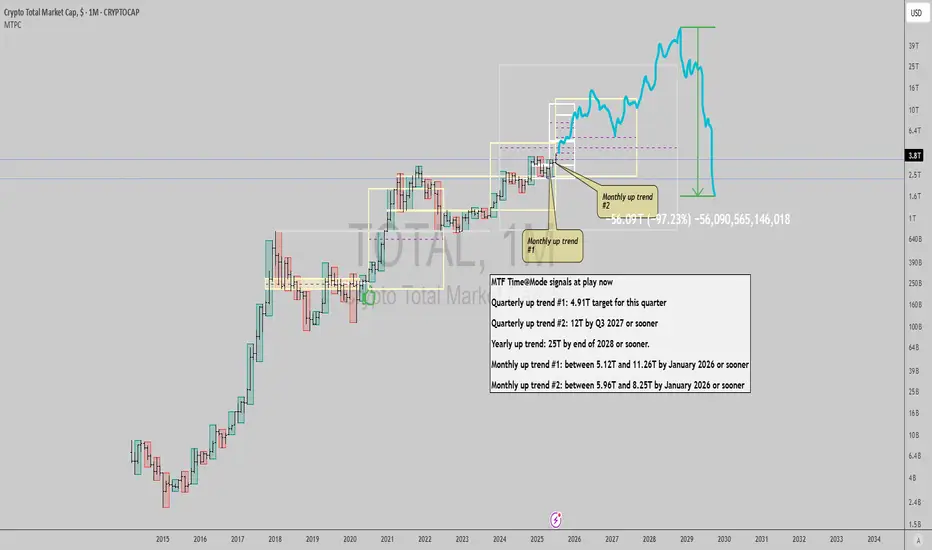
As for the crypto market, it seems that there's more upside left, if current monthly signals are not erased from here onwards:
Best of luck!
Cheers,
Ivan Labrie.
This resonates with variables observed in Pendle Finance implied vs realized yields for many stablecoins (trading below current yield signals that people are pessimistic), for example.
The chart signals I show here clash with people's meme/beliefs about market cycles duration (most think there are fixed time cycles that accurately predict bullish and bearish trends in BTC and also the timing for altcoins to outperform Bitcoin, a ridiculous notion).
What actually happens is that there are cycles of boom and bust as a feature of the fiat currency paradigm and capitalism the way we know it, which in turn cause the bullish and bearish trends in Bitcoin and Altcoins. Market data supports the idea that trends have some correlation with periods of consolidation (what Timemode patterns show) and the importance of not forcing arbitrary parameters or beliefs into the market, as it is an affair destined for failure (a sin very common in different degrees of market specialization: going from people spotting some pattern in hindsight obvious enough for them to develop a belief and market adage, to the quant systems trader figuring out how to trade the past well in backtests by curve fitting their algorithm with a specific data sample, to then fail in real trading of the present and future).
In short: expect the unexpected regarding time cycles, fixed time cycles don't work, and better obtain data from new market information to adjust your views as time goes by, if you make a prediction, verify it with post-pattern behavior to determine if it's still valid else your results will suck.
As for the crypto market, it seems that there's more upside left, if current monthly signals are not erased from here onwards:
- A drop under 3.12T would mean monthly trend is dead.
- A drop under 2.82T would mean quarterly trend is dead.
- A drop under 787B would mean yearly trend is dead and we're all gonna die.
Best of luck!
Cheers,
Ivan Labrie.
🔒Want to dive deeper? Check out my paid services below🔒
linktr.ee/ivanlabrie
linktr.ee/ivanlabrie
Disclaimer
The information and publications are not meant to be, and do not constitute, financial, investment, trading, or other types of advice or recommendations supplied or endorsed by TradingView. Read more in the Terms of Use.