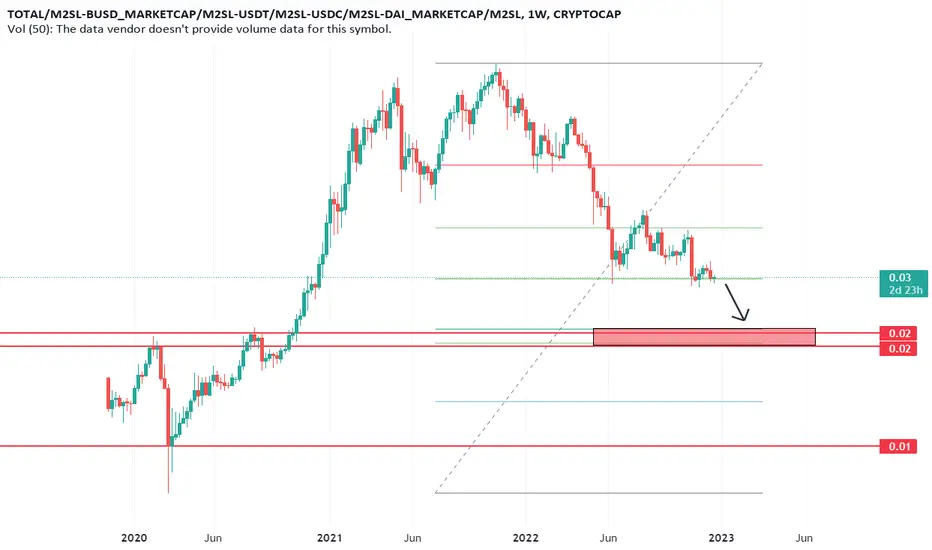
i think that this chart is very important , total market cap exclude the stable coins because we can consider them as cash ! ,
we divide it by the money supply to give as a better look .
i think that , if this current level do not hold , (50% retracement ) , the next zone would be the next obviously ,
the red zone has the 61.8fib level , hosoda target and 2 major resistance .
this is not a financial advice
thank you
we divide it by the money supply to give as a better look .
i think that , if this current level do not hold , (50% retracement ) , the next zone would be the next obviously ,
the red zone has the 61.8fib level , hosoda target and 2 major resistance .
this is not a financial advice
thank you
Note
i will be sharing ideas from my new account : tradingview.com/u/Benterkiayoucef/Disclaimer
The information and publications are not meant to be, and do not constitute, financial, investment, trading, or other types of advice or recommendations supplied or endorsed by TradingView. Read more in the Terms of Use.
Disclaimer
The information and publications are not meant to be, and do not constitute, financial, investment, trading, or other types of advice or recommendations supplied or endorsed by TradingView. Read more in the Terms of Use.