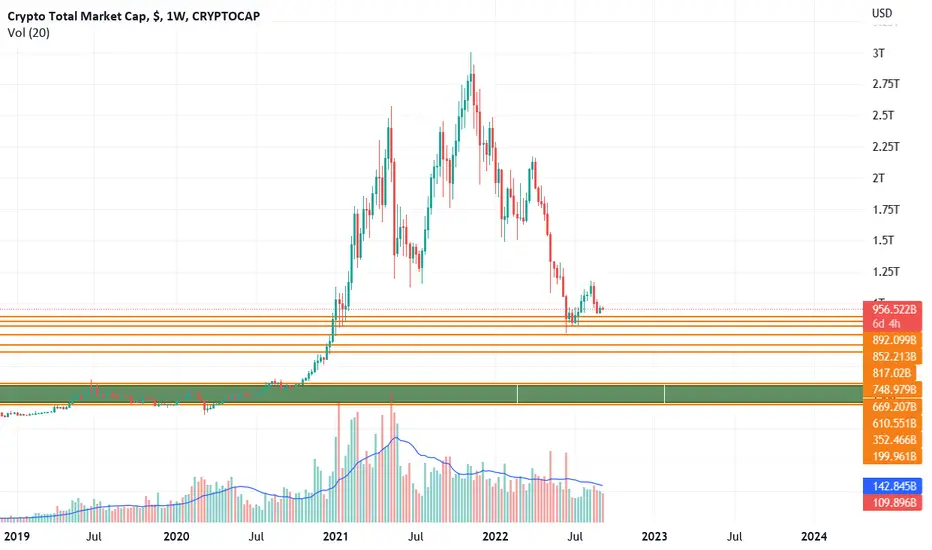
the green area represent a potential bottom for TMCap , based on hosoda wave theory and fib levels .
the other orange lines , represent potential resistance , and short term bottoms .
not a financial advice
thank you
the other orange lines , represent potential resistance , and short term bottoms .
not a financial advice
thank you
Note
i will be sharing ideas from my new account : tradingview.com/u/Benterkiayoucef/Disclaimer
The information and publications are not meant to be, and do not constitute, financial, investment, trading, or other types of advice or recommendations supplied or endorsed by TradingView. Read more in the Terms of Use.
Disclaimer
The information and publications are not meant to be, and do not constitute, financial, investment, trading, or other types of advice or recommendations supplied or endorsed by TradingView. Read more in the Terms of Use.