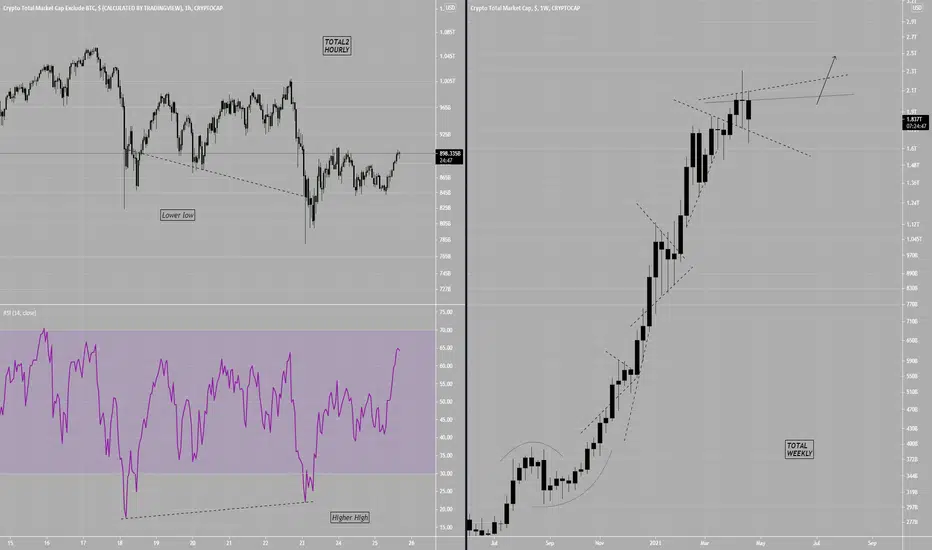
Charts for TOTAL2 showing price printing lower lows while the rsi indicator printing higher highs, this is an example of a rsi divergence
Charts for TOTAL shows that price is in a possible expanding wedge I would call it, it still looks quite bullish
In comparison though a RSI divergence on TOTAL2 Hourly is a very strong bullish sign, VeRy
Charts for TOTAL shows that price is in a possible expanding wedge I would call it, it still looks quite bullish
In comparison though a RSI divergence on TOTAL2 Hourly is a very strong bullish sign, VeRy
Disclaimer
The information and publications are not meant to be, and do not constitute, financial, investment, trading, or other types of advice or recommendations supplied or endorsed by TradingView. Read more in the Terms of Use.
Disclaimer
The information and publications are not meant to be, and do not constitute, financial, investment, trading, or other types of advice or recommendations supplied or endorsed by TradingView. Read more in the Terms of Use.