The chart is self explanatory.
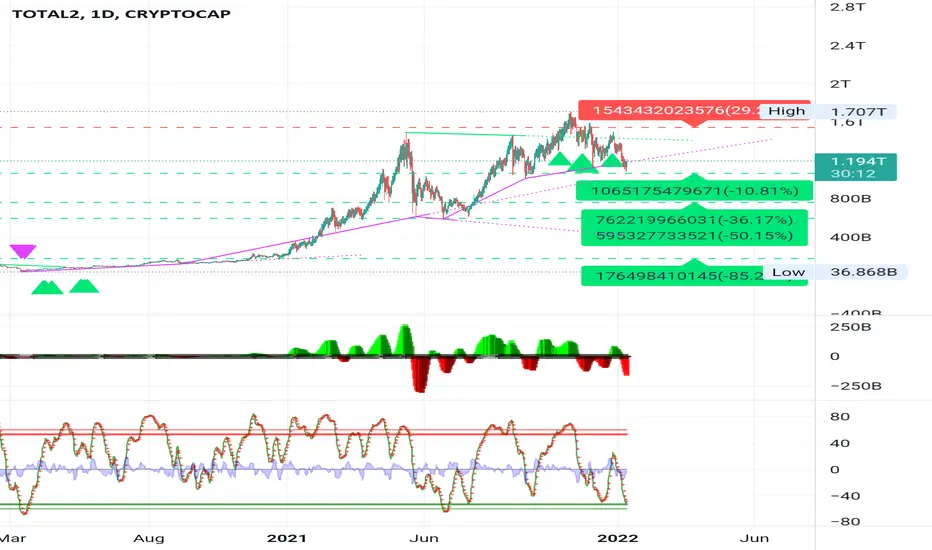
here you can see the alts performance except for bitcoin.
it is forming a triangle ( Dynamic trend line code and indicator used) for high accuracy.
it touched the strong 💪 resistance line.
we will see a Local pump to 1.4 t.
here you can see the alts performance except for bitcoin.
it is forming a triangle ( Dynamic trend line code and indicator used) for high accuracy.
it touched the strong 💪 resistance line.
we will see a Local pump to 1.4 t.
Disclaimer
The information and publications are not meant to be, and do not constitute, financial, investment, trading, or other types of advice or recommendations supplied or endorsed by TradingView. Read more in the Terms of Use.
Disclaimer
The information and publications are not meant to be, and do not constitute, financial, investment, trading, or other types of advice or recommendations supplied or endorsed by TradingView. Read more in the Terms of Use.