The daily chart for total2 to look at the impending golden cross
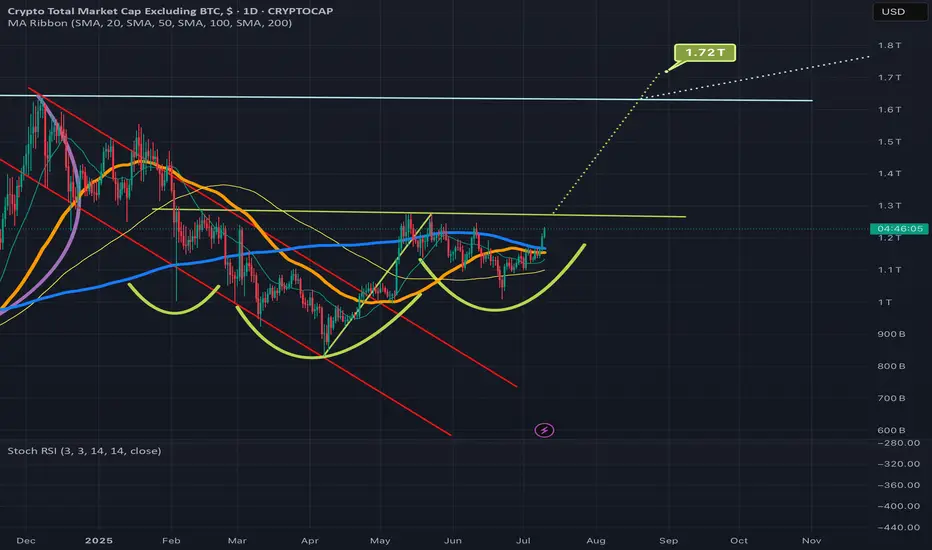
Wanted to also post a daily chart tie frame of my previous idea. I first posted it in weekly to fit the entire cup and handle breakout target in the frame, but wanted to also post the daily time frame to provide both a close up of the inverse head and shoulders pattern as well as the impending golden cross on the daily time frame. Loos very likely that alt season may finally be approaching here. Gonna pay close attention to both this chart and the bitcoin dominance chart btc.d to know for sure. *not financial advice*
Trade active
It seems as though we have confirmed the breakout from the inverse head and shoulders pattern here as price action climbs up the dotted yellow measured move line like a staircaseRelated publications
Disclaimer
The information and publications are not meant to be, and do not constitute, financial, investment, trading, or other types of advice or recommendations supplied or endorsed by TradingView. Read more in the Terms of Use.
Related publications
Disclaimer
The information and publications are not meant to be, and do not constitute, financial, investment, trading, or other types of advice or recommendations supplied or endorsed by TradingView. Read more in the Terms of Use.