One usually refers to altcoins and mems flying high when talking about big profits and pumps. So, when the next alt season could happen? To answer this question, analysts usually examine ETH and the Crypto Total Market Cap (excluding BTC and ETH) charts to make a prediction. Moreover, I think it is worth analyzing the Dominance of altcoins (excluding BTC and ETH) as well. I already analyzed the ETH before and updating it periodically, so let's look at the Crypto Total Market Cap.
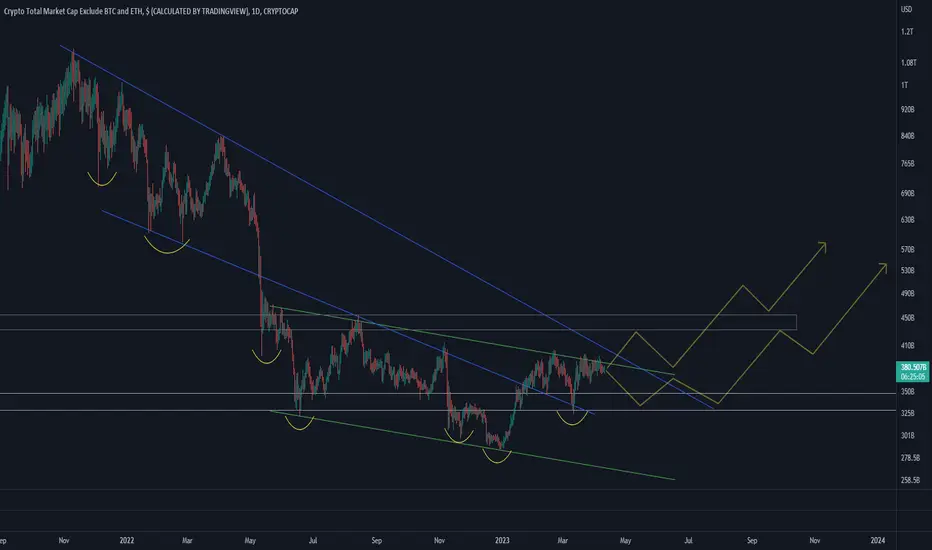
When looking at the Total Market Cap chart, it is evident that there was a downtrend in which lower lows were made one after another. Recently, in March 2023, a higher high and a higher low were made; a sign of a possible reversal. But, two higher highs and two higher lows are needed, at least, for the reversal confirmation. Furthermore, the value/price of the Total Market Cap must not breach the recent higher low. Based on the technical analysis, two possible scenarios can play out that are drawn on the chart.
When looking at the Total Market Cap chart, it is evident that there was a downtrend in which lower lows were made one after another. Recently, in March 2023, a higher high and a higher low were made; a sign of a possible reversal. But, two higher highs and two higher lows are needed, at least, for the reversal confirmation. Furthermore, the value/price of the Total Market Cap must not breach the recent higher low. Based on the technical analysis, two possible scenarios can play out that are drawn on the chart.
Note
Next, let's look at the Dominance chart of altcoins. As seen from the chart, it seems an inverted wedge/triangle pattern has formed, a big one.
Also, the Dominance is currently in a downtrend move, possibly a channel. Moreover, there is a harmonic pattern too, but not sure if the right leg is finished or going down further. Anyway, the next altseason happens when the Dominance breaks the downtrend channel and/or the right leg of the harmonic pattern finishes.
A point about inverted wedge patterns: usually or many times, price loses momentum to reach the upper or lower band of the inverted wedge and when it does, for the final wave, it goes through it and breaks the pattern; Just like here where the last upward wave didn't reach the upper band. However, we can't tell the same for the current downtrend wave; if it reaches the lower band or not. I think, or hope :), the current descending wave won't reach the lower band of the inverted wedge.
Note
Another great chart to consider is Bitcoin Dominance. If we look at this chart we can see that Bitcoin's Dominance has been oscillating in a sideway channel. If its value breaks this channel in either direction, remarkable events would happen in the market. However, breaking this area upward won't be good news for the altcoins, so watch out. Currently, it seems a harmonic pattern is formed and possibly finished. If this pattern proves to be valid and the uptrend line is broken downward, it means good news for altcoins. Let's see what happens.
Note
It seems Crypto Total Market Cap (excluding BTC and ETH) is going for the second scenario; that is making another low. That is why all the altcoins are going down. However, this low must not breach the previous low; if does, the whole waves count and HH and HL must redrawn. Let's see what happens.
Note
Dominance chart of altcoins show a divergence which could be a harbinger of altcoins impulse wave. Let's see what happens.
Note
As stated, if Bitcoin Dominance breaks the sideway channel upward, bad news for altcoins. So, this happened!
Note
It seems Crypto Total Market Cap (excluding BTC and ETH) is going to make another lower low. Have to wish for the lower green line to hold it. If not, there gonna be an altcoin nightmare.
Note
The same is true for the Dominance chart of altcoins. If the lower band of this big inverted wedge/triangle pattern breaks, very bad news for altcoins. Let's hope not.
Note
It seems an inverse head and shoulders pattern might be forming in the Crypto Total Market Cap (excluding BTC and ETH). Have to wait for the confirmation: the pink line breaks upward. If true, a good season for altcoins could happen. Let's see what happens.
Note
If Dominance chart of altcoins could also break above the middle line of its downtrend channel or eventually break the channel, this could be the second confirmation for altseason.
Note
So, the Crypto Total Market Cap (excluding BTC and ETH) successfully broke the long downtrend line. It is a good sign. Now we have to wait and see if it can break the pink line too or not. The pink line is the neck line of the inverted Head and Shoulders pattern. Let's see what happens.
Note
So, the Dominance chart of altcoins broke above the descending channel, and the first signal for altcoins season was triggered. Now, we have to wait for the Crypto Total Market Cap (excluding BTC and ETH) to break the pink line and the inverted Head and Shoulders pattern confirmation. Let's see what happens.
Note
The Dominance chart of altcoins is right on track.
Note
So, the good news is that the Crypto Total Market Cap (excluding BTC and ETH) successfully broke the neckline of the inverted Head and Shoulders pattern.
Note
The Dominance chart of altcoins is also going upward.
Note
If Bitcoin Dominance reacts to the upper line and comes down, that means altcoins will go up faster. Let's see what happens.
Note
Exactly as expected. So the Bitcoin Dominance is moving in an ascending triangle pattern. Good things can happen for altcoins. Let's see which way Bitcoin Dominance will go next.
Note
So, the Crypto Total Market Cap (excluding BTC and ETH) also broke the horizontal resistance area and is going up toward the wide channel's middle line. Let's see when this line breaks.
Note
So, the Crypto Total Market Cap (excluding BTC and ETH) reached the wide channel's middle line. If this middle line breaks upward, that means the wide channel's upper line is also available. Let's see what happens.
Note
Both the Bitcoin Dominance and Total3 show signs of correction; and that means the whole market. Let's see what happens.
Note
If we look at these three charts, it seems Bitcoin Dominance is moving in a descending channel while Total3 is not and altcoins dominance is moving in an ascending channel. If things remain this way, this can mean two things; either Bitcoin continue the correction and altcoins remain almost stationary or rise slightly. Or, Bitcoin oscillate and altcoins go up. Let's see what happens.
Note
This is just to update the altcoins' dominance chart; it seems an inverted wedge pattern is formed. If the bottom holds and a new upward wave start, it is going to be a strong one. Let's see what happens.
Note
Following from previous analysis, Bitcoin Dominance posed for depletion at the channel's upper line. At the same time, altcoins Dominance chart posed for an upward move. So, if true, brace yourself for altcoins upward moves. Let's see what happens.
Note
So, Total 3 reached the wide channel's middle line, again. If Total 3 cannot break this line, another correction awaits for altcoins; especially for the big cap altcoins.
Note
So, it seems TOTAL 3 is breaking the channel's middle line; that means say hello to the channel's upper line. Don't miss on this opportunity. On the other hand, it seems OTHERS got a little stuck above the major horizontal resistance area. That means low cap/dominance altcoins still not moving upward. Still waiting for upward movement confirmation. Let's see what happens.
Note
So, continuing from the last analysis; the Bitcoin Dominance chart bounced off the minor descending channel's upper line and came down, then midway down, an upward wave started and broke the channel upward. As a result, Bitcoin price went up, or some say the other way around. Anyway, then the Bitcoin Dominance made a pullback on the broken channel, and now it seems posed for another upward movement. If happens, bitcoin will break its ATH level. Let's see what happens.
Note
So, now that many people have noticed the altcoins' upward wave (phase one), how high these altcoins can go? That's a billion-dollar question. Alt-season consist of three phases; most people miss out on the phase one, which is finished, since it is too hard to pinpoint the reversal exactly and also hard to believe that alt-season has started-denial. But when people see Bitcoin breaks highs and achieve new one every day and altcoins do that too, people and money flows in, that's phase two. Phase two is the longest phase which will take altcoins to their moon. Finally, when people try to extract the last drop of the alt-season, that's phase three. Then Bitcoin's major correction start, probably, and alt-season ends.
Now let's look at the TOTAL3 chart; phase 1 is finished and TOTAL3 broke the channel's middle line. That means TOTAL3 is headed toward the channel's upper line, and phase 2 will start, or started. There are two major targets which are shown in yellow. Also, TOTAL3 past analysis shows that previous upward wave has reached the Fib level 1 extension. If TOTAL3 could reach the same level in the current upward wave, that means TOTAL3 has to break the first yellow target and rise much higher. Let's see what happens.
Keep in mind that this analysis looks into the future, deep into the future, thus things could unfold a little different. Will post updates here.
Note
So, let's look at the Bitcoin Dominance chart. It seems, a previous major behavioral movement might repeat in a minor scale. In the past, Bitcoin Dominance made a double top and then a downward wave started which broke the bottom. Now, it seems almost like this behavior is happening. If true, huge rise can be anticipated for altcoins. Of course, have to wait and see if Bitcoin Dominance breaks the double top area, or comes down and breaks the minor bottom. Let's see what happens.
Note
So, following from previous analysis, After OTHERS Dominance broke the major horizontal resistance area, OTHERS was oscillating above this area for a while. It seems a wedge pattern is forming. When OTHERS breaks this pattern upward, altcoins start to rise again. Let's see when it does.
Note
So, it is clear that OTHERS Dominance couldn't break this wedge pattern and correction in process. Also, Bitcoin is in correction too; and that means whole crypto market going to be in correction for a while. Let's see when correction end.
Note
So, TOTAL3 made a pullback on the wide channel's middle line and the minor uptrend line. Phase 2 is ready to start. Let's see what happens.
Note
So, the Bitcoin Dominance didn't progress according to Mar 14 scenario. It seems Bitcoin Dominance's Mar 3 scenario is unfolding. Anyway, if Bitcoin Dominance wants to go down, there are two support zones that must break first; the horizontal area and the uptrend line. Let's see what happens.
Note
So, the Bitcoin Dominance broke both minor support zones. Could it go down straight? Or there might be a pullback? Let's see what happens.
Note
So, TOTAL3 made a pullback on the wide channel's middle line, went up and broke the minor downtrend line too. On the other hand, OTHERS Dominance still oscillating in the major horizontal resistance area. This might mean that Top altcoins are ready to make some movements. Let's see what happens.
Note
So, Bitcoin Dominance is coming down, TOTAL3 broke the minor downtrend line and made a pullback too. That means top altcoins are on he moves. For smaller altcoins, we need to see OTHERS Dominance start going up, which still oscillating. Let's see what happens.
Note
Following the Mar 10 update: It seems the transition from Phase 1 to Phase 2 is almost finished. Phase 2 (the next uptrend wave) will begin soon. The first major resistance is the blue channel's upper line, which is also the 1.618 Fib extension level. There are two scenarios for Phase 2: 1) Phase two could be the extended one, like the previous one, and thus Phase 3 could be the short one. 2) Phase 2 does not extend as much as it is supposed to, and thus Phase 3 extends more than normal. Let's see what happens.
Note
An important point worth to keep in mind about OTHERS Dominance is that, when compared with the Bitcoin chart, it seems OTHERS is always lag behind the Bitcoin. If we look closely, OTHERs' tops and bottoms form a few weeks later than Bitcoin.
Note
So, OTHERS Dominance is still oscillating right where it was. Also, OTHERS Dominance made another visit to the minor horizontal area below. Only 2 weeks are left for OTHERS Dominance to reach the Fib time zone. Does this line prove to be the start of the next phase? Let's see what happens.
Note
So, TOTAL3 broke the wide channel's middle line downward. It's normal; many times, a channel's middle line works like a magnet, and as a result, price oscillate around it before gaining momentum for continuation. There are two possible targets for TOTAL3: the uptrend line and the major horizontal resistance area. Let's see what happens..
Note
So, TOTAL3 went down and reached the uptrend line, touched it and started an upward wave. On the other hand, it seems that the momentum of Bitcoin Dominance's bullish movement is decreasing and the upward movement is turning sideways. If TOTAL3 breaks the minor downtrend line and Bitcoin Dominance keeps sideways movement, or even starts a downward one, that means the altseason second phase is starting. Let's see what happens.
Note
So, Bitcoin's next rally starts when Bitcoin Dominance breaks the current horizontal resistance area and goes toward the next one. When Bitcoin's Dominance reaches the second horizontal area, then the next altcoins rally will start, which always lags behind Bitcoin (read the Jun 4 comment). Then Bitcoin's Dominance starts to come down. Let's see what happens.
Note
Get ready!
Note
So, OTHERS Dominance went down, touched the major ascending channel's lower line, and made a harmonic pattern too. Then, OTHERS broke the harmonic pattern's right leg downtrend line and it seems started an upward impulse wave. For confirmation, OTHERS have to break the horizontal resistance area first. Let's see what happens.
Note
So, TOTAL3 broke the downtrend channel, and it seems the correction is over and phase 2 has started. There is going to be a pullback, probably. Let's see what happens.
Note
So, Bitcoin Dominance and TOTAL3 are going according to the previous analyses. What could happen is like this: Bitcoin is still in the upward phase and altcoins also will go up along with Bitcoin, although not quite with strong momentum. Then when Bitcoin's last wave, the wave 5, finish, that's when a big harmonic pattern is formed in Bitcoin Dominance chart, then altcoins get an extra boost which would accelerate the upward movement. Also, this is when you should be ready to opt out from altcoins, since it will be fast, and you could get caught in the hype. Let's see what happens.
Note
VIP Telegram channel: t.me/saeedcrypto_publicTrade active
Ready or not, here come the OTHERS Dominance; the crypeo market is up.
Note
So, Bitcoin Dominance went down and broke the long ascending channel, resulting in altcoins going up. Now, Bitcoin Dominance has reached a minor horizontal support area, so have the OTHERS Dominance. If Bitcoin Dominance break this area downward, that means Bitcoin won't be making another huge upward move, maybe a small one. As a result, altcoins upward move will continue. But, if this area support Bitcoin, and Bitcoin Dominance goes up another time, probably for the last time in this cycle. That means, Bitcoin price will go up and altcoins go down. Until Bitcoin Dominance reaches the major horizontal resistance area again and start the sharp downward again. Vice versa will happen for altcoins. Let's see what happens.
Note
So, Bitcoin Dominance analysis is still valid, with a little change; an inverted wedge is formed at the end of the harmonic pattern's right leg. When Bitcoin finishes its final upward wave in the current cycle, which is unfolding, the Bitcoin Dominance starts to fall. And then the Altcoins' Bull run, the final wave, starts. Let's see what happens.
Related publications
Disclaimer
The information and publications are not meant to be, and do not constitute, financial, investment, trading, or other types of advice or recommendations supplied or endorsed by TradingView. Read more in the Terms of Use.
Related publications
Disclaimer
The information and publications are not meant to be, and do not constitute, financial, investment, trading, or other types of advice or recommendations supplied or endorsed by TradingView. Read more in the Terms of Use.