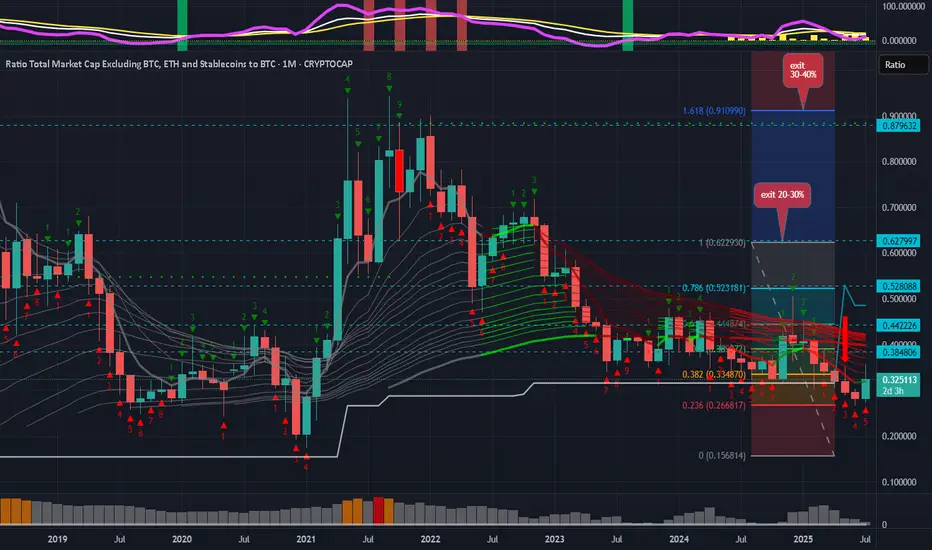
ALT-COINS MOST IMPORTANT CHART -2027-2028

Hi
Not many charts out there about watch the total3 versus bitcoin
but this chart had signaled the last 2021 boom for altcoins
this could happen again into the following years to come
this is a long ride
for the patient
and the active trader or investor manager
yes retail at some point will be very small comparing to institutional smart money inflows
into some top 100 altcoins from 2030-2040
but
we don t know for now what altcoins will perform long term
we may guess the winners more than the losers hopefully
the first sign would be ETH outperforming BTC
i may update this chart in the next 6mo- to see the reversal signal -into the bullmarket
territory possible sooner than later could be q42025 or early 2026
i anticipate a cycle peak around mid 2027 thro early 2028
also a prolonged cycle could emerge and take us thro 2031
each of the fib target on this chart may experience a bigger or lager pullback
that is why a win win could be to sell something on each target and DCA back into alts later
smart money may also rotate from traditional market like Sp500 and from safe heaven assets risk off into more volatile beta assets with risk on tags. as long as they dont break ATHs again
Note
note: last two fib targets on this chart could be hit one in 2027 and other in 2031;🎂🎂🎂Disclaimer
The information and publications are not meant to be, and do not constitute, financial, investment, trading, or other types of advice or recommendations supplied or endorsed by TradingView. Read more in the Terms of Use.
Disclaimer
The information and publications are not meant to be, and do not constitute, financial, investment, trading, or other types of advice or recommendations supplied or endorsed by TradingView. Read more in the Terms of Use.