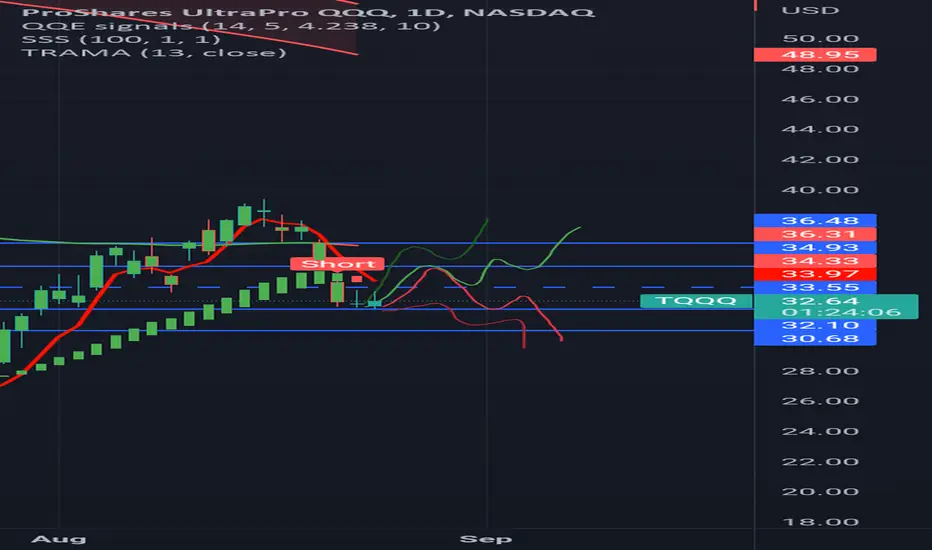
price action daily nasdaq is ranging around the lows with the bounce not escaping vertical gravity, and the candlestick pattern forming either a bear flag or a bullish reversal. if we cross above pivot im looking at upper horizontals as resistance, and if we cross below it im looking at lower horizontals as support.
Related publications
Disclaimer
The information and publications are not meant to be, and do not constitute, financial, investment, trading, or other types of advice or recommendations supplied or endorsed by TradingView. Read more in the Terms of Use.
Related publications
Disclaimer
The information and publications are not meant to be, and do not constitute, financial, investment, trading, or other types of advice or recommendations supplied or endorsed by TradingView. Read more in the Terms of Use.