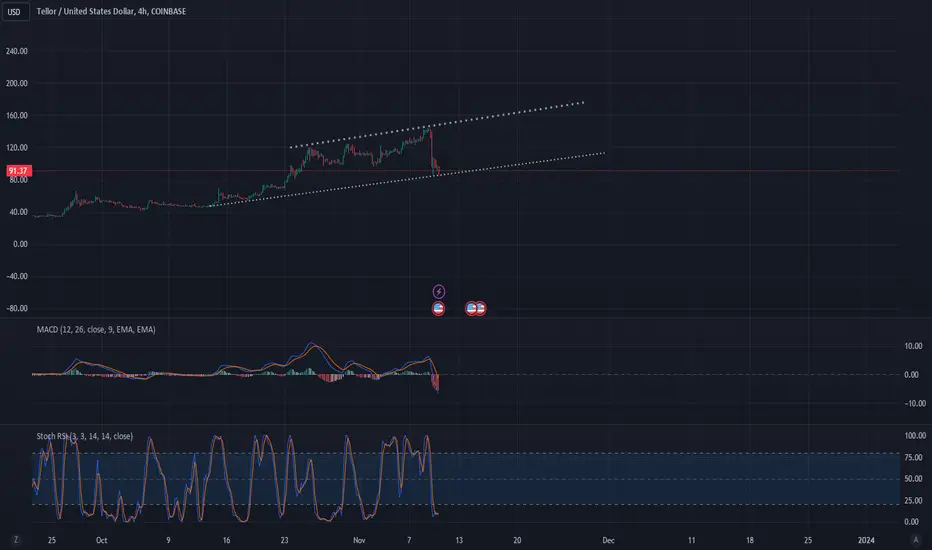
TRB LONGTERM HORIZONTAL BULL-RUN?
The chart is broken for parabolic.
But it seems to stabilize above $88 and $91.
Meaning further in the bull-run it goes to long-term support zones.
RSI bearish
Macd bearish
Stoch rsi bullish
The chart is broken for parabolic.
But it seems to stabilize above $88 and $91.
Meaning further in the bull-run it goes to long-term support zones.
RSI bearish
Macd bearish
Stoch rsi bullish
Disclaimer
The information and publications are not meant to be, and do not constitute, financial, investment, trading, or other types of advice or recommendations supplied or endorsed by TradingView. Read more in the Terms of Use.
Disclaimer
The information and publications are not meant to be, and do not constitute, financial, investment, trading, or other types of advice or recommendations supplied or endorsed by TradingView. Read more in the Terms of Use.