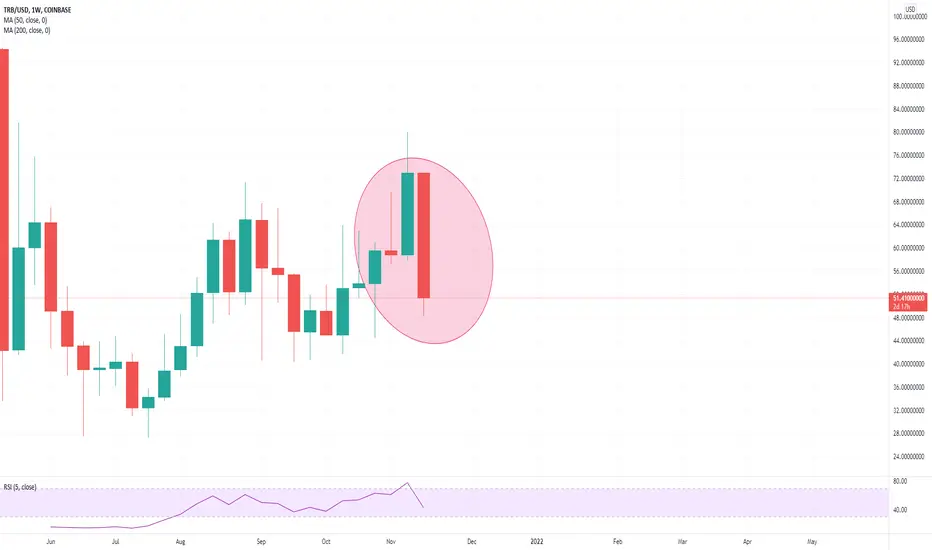
As we see, bearish engulfing is creating in weekly chart which means that we will go down 30-50% more.
Look at the chart of MANA or RNDR. When BTC is going down, RNDR and MANA is going UP.
If we look chart of TRB, we see different case. When BTC is going down, TRB is going more down, 3 times more then BTC.
Look at the chart of MANA or RNDR. When BTC is going down, RNDR and MANA is going UP.
If we look chart of TRB, we see different case. When BTC is going down, TRB is going more down, 3 times more then BTC.
Disclaimer
The information and publications are not meant to be, and do not constitute, financial, investment, trading, or other types of advice or recommendations supplied or endorsed by TradingView. Read more in the Terms of Use.
Disclaimer
The information and publications are not meant to be, and do not constitute, financial, investment, trading, or other types of advice or recommendations supplied or endorsed by TradingView. Read more in the Terms of Use.