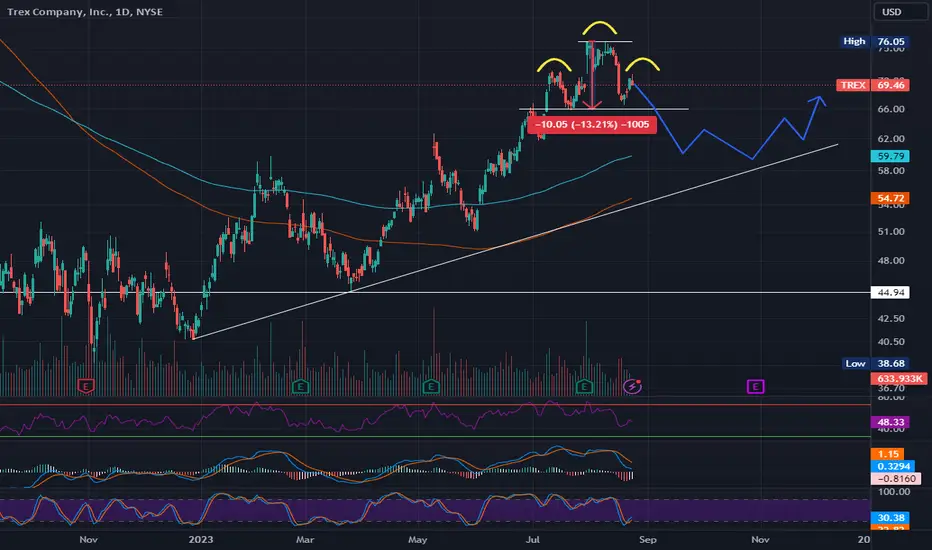
Head and shoulders on the daily chart. Neckline around 66. This is either a buy point or the sign to buy.
High of 76 tested a few times over the last few weeks. H&S could lead to $56, $60, or $63. Support ranges.
Nibble all the way down...?!
High of 76 tested a few times over the last few weeks. H&S could lead to $56, $60, or $63. Support ranges.
Nibble all the way down...?!
Note
Right shoulder formed. Can we confirm H&S and a fall to support around $60?Note
We've broken the neckline. Here we go!Note
This is where we start buying the trend and setting our stop lossesNote
Confirming breaking of support. Maybe we look towards the $45 level for support from hereNote
This works out very well =DDisclaimer
The information and publications are not meant to be, and do not constitute, financial, investment, trading, or other types of advice or recommendations supplied or endorsed by TradingView. Read more in the Terms of Use.
Disclaimer
The information and publications are not meant to be, and do not constitute, financial, investment, trading, or other types of advice or recommendations supplied or endorsed by TradingView. Read more in the Terms of Use.