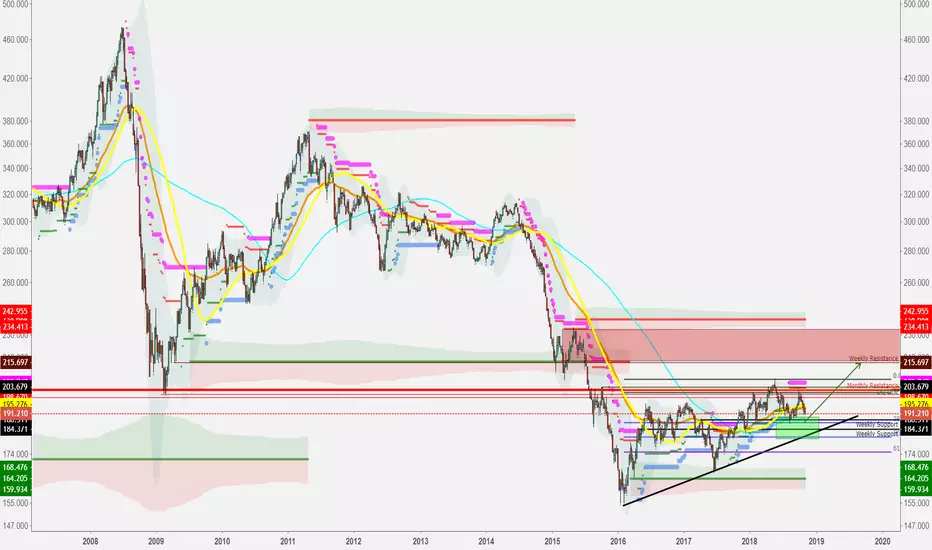
A weekly chart informed from a monthly chart's support and resistance. As you can see from here, the CRB index fell from the monthly resistance above after forming a new high breaking resistance (also a yearly autp pivot point). It pulled back to the 38% level, which is also a weekly support level.
Capturing the swings of the stock market & currency market. It's a dirty job and equity/currency traders must do it.
Disclaimer
The information and publications are not meant to be, and do not constitute, financial, investment, trading, or other types of advice or recommendations supplied or endorsed by TradingView. Read more in the Terms of Use.