Long
TROY / BTC -
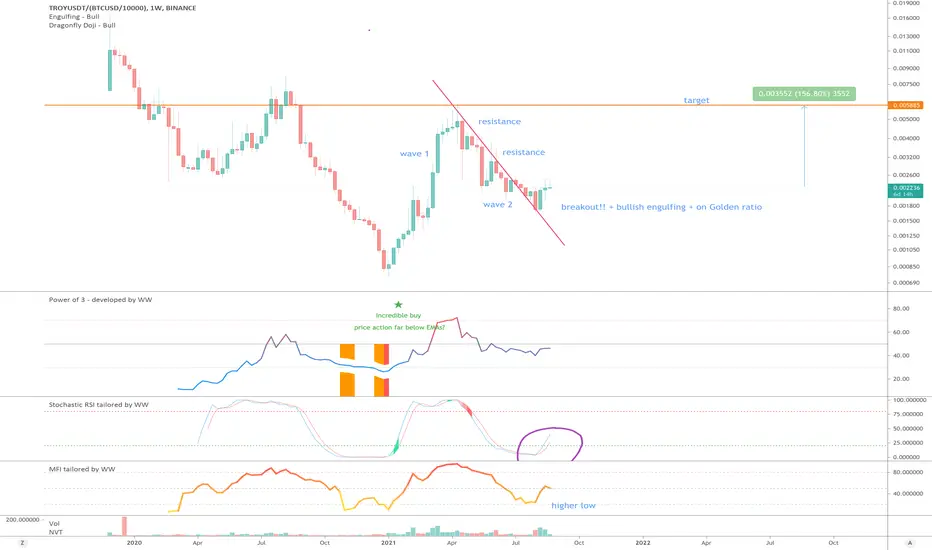
A 65% correction since early April with oversold condition (orange column) and ‘incredible buy’ opportunity, now is an excellent time to be bullish. Why?
On the above weekly chart:
1) Price action breaks out of resistance.
2) Price action prints a bullish engulfing candle after finding support on the 786 golden ratio (not shown here).
3) Stochastic RSI (circled in purple) crosses up 20 after a 120 days since crossing down 80. Very bullish.
4) On the 2-week (below) chart price action recently prints a Dragonfly DOJI candle. You don’t often see those on the alt-coin / BTC charts, but when you do…
Is it possible price action falls further? Sure.
Is it probable? Very unlikely.
1st target 6000 sats.
2nd target 13k sats
Good luck,
WW
The 2-week chart:
Trade active
Trade active
1st target reached. Stay long for the moment.Trade active
resistance broken, next target 5k satsNote
Making great progress. No indication of a sell signal at this time.BTC
bc1q2eckdzh0q8vsd7swcc8et6ze7s99khhxyl7zwy
Weblink: patreon.com/withoutworries
Allow 3-6 months on ideas. Not investment advice. DYOR
bc1q2eckdzh0q8vsd7swcc8et6ze7s99khhxyl7zwy
Weblink: patreon.com/withoutworries
Allow 3-6 months on ideas. Not investment advice. DYOR
Disclaimer
The information and publications are not meant to be, and do not constitute, financial, investment, trading, or other types of advice or recommendations supplied or endorsed by TradingView. Read more in the Terms of Use.
BTC
bc1q2eckdzh0q8vsd7swcc8et6ze7s99khhxyl7zwy
Weblink: patreon.com/withoutworries
Allow 3-6 months on ideas. Not investment advice. DYOR
bc1q2eckdzh0q8vsd7swcc8et6ze7s99khhxyl7zwy
Weblink: patreon.com/withoutworries
Allow 3-6 months on ideas. Not investment advice. DYOR
Disclaimer
The information and publications are not meant to be, and do not constitute, financial, investment, trading, or other types of advice or recommendations supplied or endorsed by TradingView. Read more in the Terms of Use.