The move in line with our monthly chart technical view.
Truworths sold off sharply today (-12.5%) on the back of their results released after yesterday's market close. The move lower has aligned with our 02-August comment, suggesting that long term holders should consider reducing.
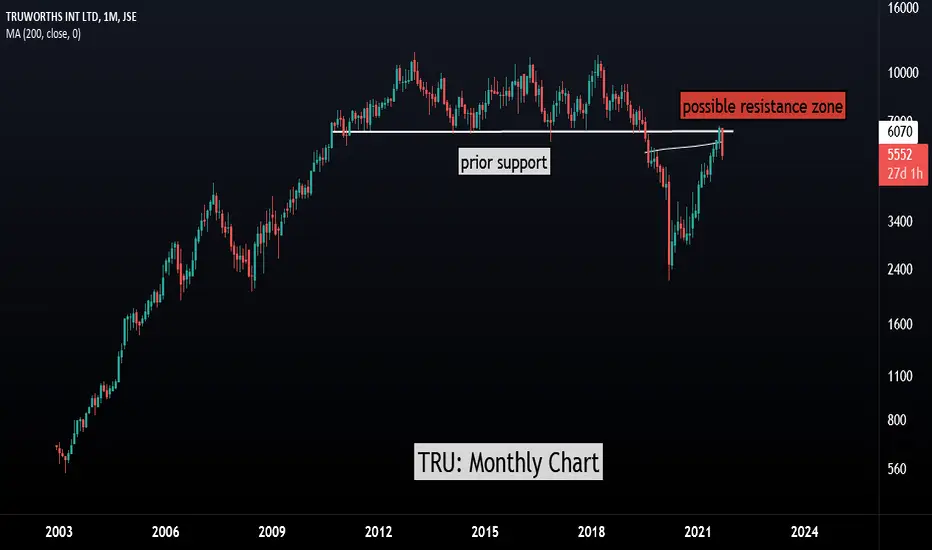
Based on the monthly chart, the view took into consideration the prior support acting as a potential resistance zone.
The original comment on 02 Aug (with annotations on the chart) was follows:
Truworths International Ltd(TRU, 6180c ) | Bottom Line: Price testing 200-week moving average. Long-term holders consider reducing. Key Points(s):The group provided a business update for the 52-weeks ended 27 June 2021 indicating that the business has been materially affected by the impact of the pandemic. Reviewing the long term (weekly chart) we note the price having advanced strongly off the March 2020 lows however, the price is nearing a resistance range, that being the previous support, which may now act as resistance, as well as the 200-week moving average. Long term holders should consider reducing positions at or around current levels. MONTHLY CHART
For more insights, real-time ideas or a review of current portfolio holdings to assess where risks may be lurking, get in touch today.
Truworths sold off sharply today (-12.5%) on the back of their results released after yesterday's market close. The move lower has aligned with our 02-August comment, suggesting that long term holders should consider reducing.
Based on the monthly chart, the view took into consideration the prior support acting as a potential resistance zone.
The original comment on 02 Aug (with annotations on the chart) was follows:
Truworths International Ltd(TRU, 6180c ) | Bottom Line: Price testing 200-week moving average. Long-term holders consider reducing. Key Points(s):The group provided a business update for the 52-weeks ended 27 June 2021 indicating that the business has been materially affected by the impact of the pandemic. Reviewing the long term (weekly chart) we note the price having advanced strongly off the March 2020 lows however, the price is nearing a resistance range, that being the previous support, which may now act as resistance, as well as the 200-week moving average. Long term holders should consider reducing positions at or around current levels. MONTHLY CHART
For more insights, real-time ideas or a review of current portfolio holdings to assess where risks may be lurking, get in touch today.
Disclaimer
The information and publications are not meant to be, and do not constitute, financial, investment, trading, or other types of advice or recommendations supplied or endorsed by TradingView. Read more in the Terms of Use.
Disclaimer
The information and publications are not meant to be, and do not constitute, financial, investment, trading, or other types of advice or recommendations supplied or endorsed by TradingView. Read more in the Terms of Use.