hi traders,
🧠 Chart Overview
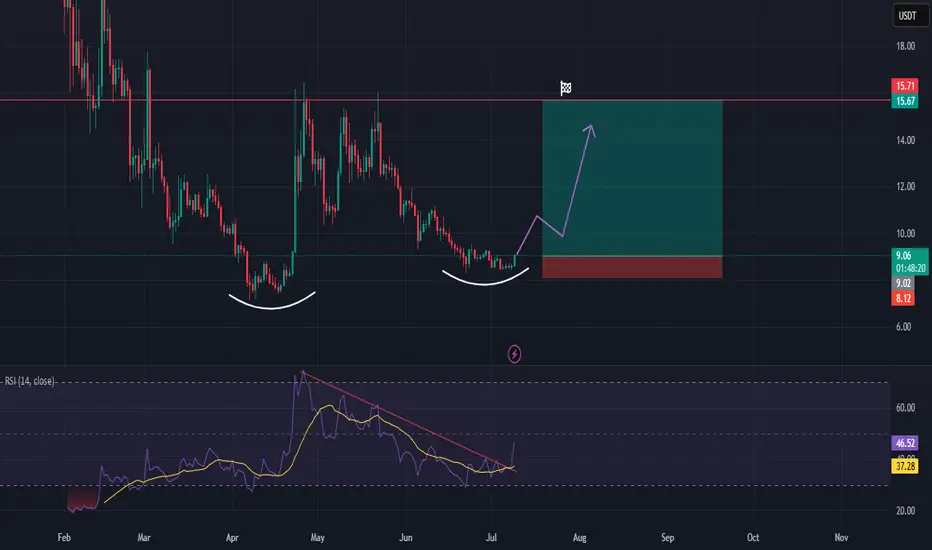
Asset: TRUMPUSDT
Timeframe: Daily
🔍 Technical Analysis
Price Structure: We can see a double bottom or rounded bottom formation, suggesting a potential trend reversal from bearish to bullish.
RSI Indicator: The RSI has broken out of its long-term downtrend, which is a key early bullish signal. It has also crossed above its moving average, hinting at growing momentum.
Confirmation: The price has confirmed a bottom around the $7–$8 range, with multiple tests of support and a slight upward curve forming.
💡 Trading Setup
Entry: It is still early to enter a long position at the current levels (9$)
Target: The upside target is the major resistance at $15.70, aligning with the previous high marked by the red horizontal line.
Stop Loss: The stop loss is placed below the recent lows, around the $8.12 level, ensuring protection if the bottom doesn't hold.
⚠️ Notes
Entering now is aggressive and speculative, but early positioning can offer higher R:R.
Conservative traders might wait for a confirmed breakout above $10 before entering.
Volume confirmation would strengthen this setup further.
This is a classic early-reversal setup — worth watching closely!
🧠 Chart Overview
Asset: TRUMPUSDT
Timeframe: Daily
🔍 Technical Analysis
Price Structure: We can see a double bottom or rounded bottom formation, suggesting a potential trend reversal from bearish to bullish.
RSI Indicator: The RSI has broken out of its long-term downtrend, which is a key early bullish signal. It has also crossed above its moving average, hinting at growing momentum.
Confirmation: The price has confirmed a bottom around the $7–$8 range, with multiple tests of support and a slight upward curve forming.
💡 Trading Setup
Entry: It is still early to enter a long position at the current levels (9$)
Target: The upside target is the major resistance at $15.70, aligning with the previous high marked by the red horizontal line.
Stop Loss: The stop loss is placed below the recent lows, around the $8.12 level, ensuring protection if the bottom doesn't hold.
⚠️ Notes
Entering now is aggressive and speculative, but early positioning can offer higher R:R.
Conservative traders might wait for a confirmed breakout above $10 before entering.
Volume confirmation would strengthen this setup further.
This is a classic early-reversal setup — worth watching closely!
💥 Free signals and ideas ➡ t.me/vfinvestment
Disclaimer
The information and publications are not meant to be, and do not constitute, financial, investment, trading, or other types of advice or recommendations supplied or endorsed by TradingView. Read more in the Terms of Use.
💥 Free signals and ideas ➡ t.me/vfinvestment
Disclaimer
The information and publications are not meant to be, and do not constitute, financial, investment, trading, or other types of advice or recommendations supplied or endorsed by TradingView. Read more in the Terms of Use.