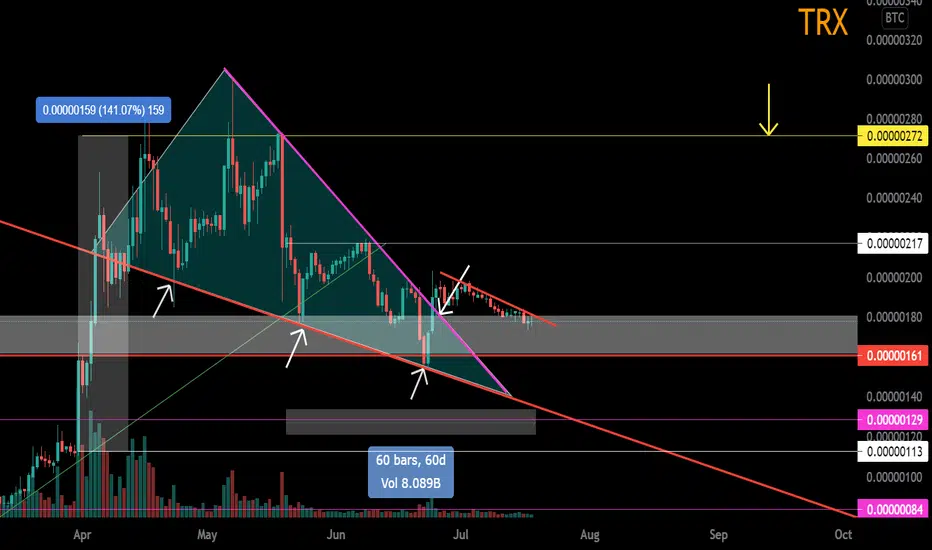
Notice how the wedge formed above the main trend line. The resistance of the wedge has been broken. The pullback.
The price is 2 months in a sideways pattern in 25% steps. Intraday volatility in this pair is minimal.
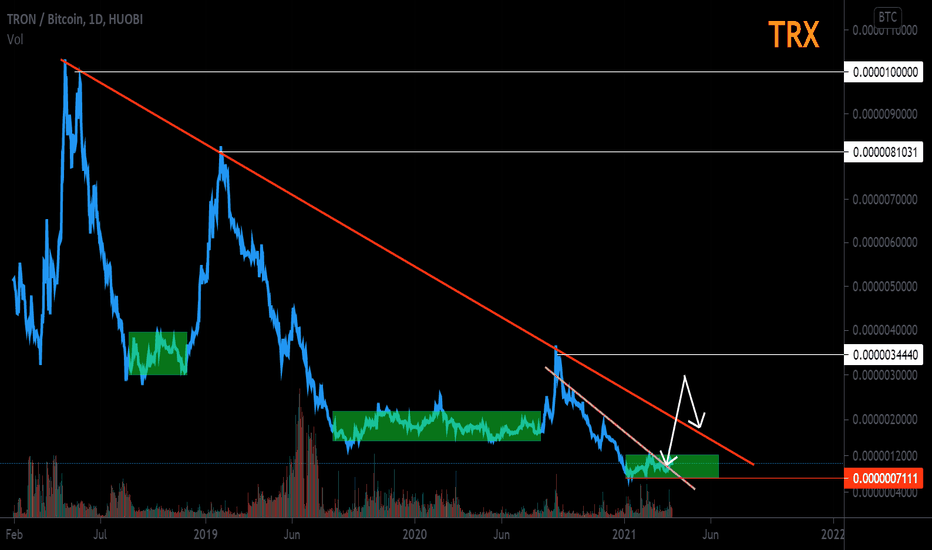
The gray area is this support zone of the channel of the main set of 2019 - 2020 position. This is clearly visible on the line chart on the weekly timeframe.
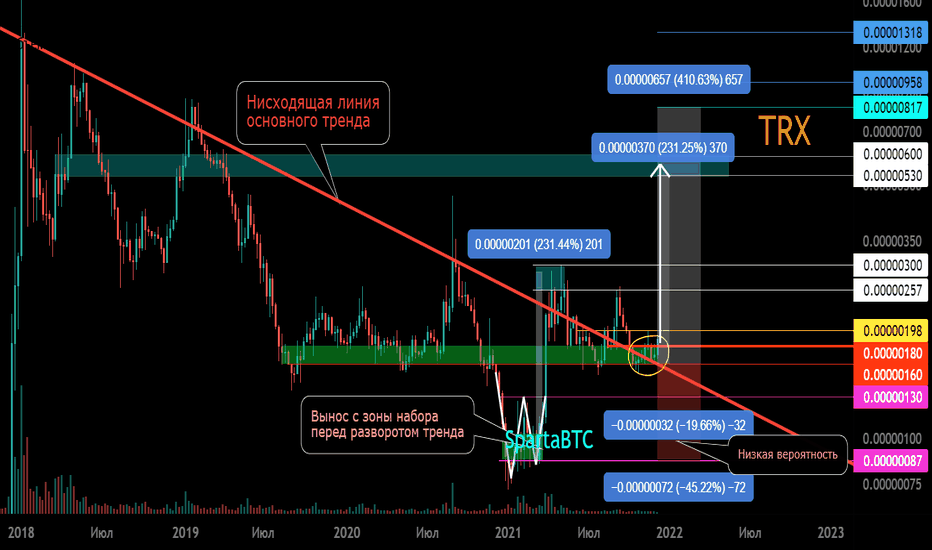
TRX / BTC Main trend. Linear graph. Trend reversal zones
The price is 2 months in a sideways pattern in 25% steps. Intraday volatility in this pair is minimal.
The gray area is this support zone of the channel of the main set of 2019 - 2020 position. This is clearly visible on the line chart on the weekly timeframe.
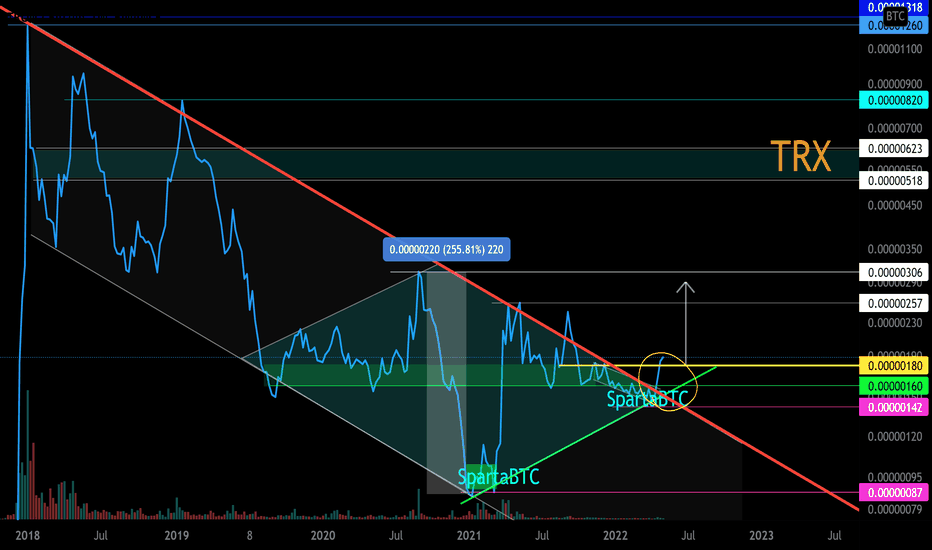
TRX / BTC Main trend. Linear graph. Trend reversal zones
Note
Note
Note
Note
Note
Note
Note
✅ Telegram. Finance + Trading: t.me/SpartaBTC_1318
✅ Telegram. Сrypto trading only: t.me/SpartaBTC_tradingview
✅ Instagram: instagram.com/spartabtc_1318
✅ YouTube (Rus): goo.su/vpRzRa2
✅ Telegram. Сrypto trading only: t.me/SpartaBTC_tradingview
✅ Instagram: instagram.com/spartabtc_1318
✅ YouTube (Rus): goo.su/vpRzRa2
Related publications
Disclaimer
The information and publications are not meant to be, and do not constitute, financial, investment, trading, or other types of advice or recommendations supplied or endorsed by TradingView. Read more in the Terms of Use.