Hi guys,
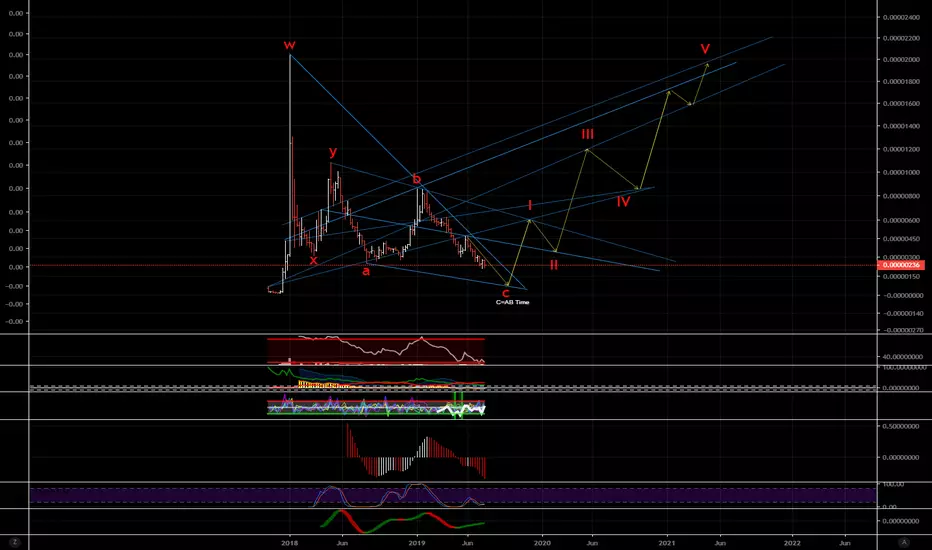
Had a look at the TRXBTC chart and (of course this is way too far into the future to tell) just using some trendlines and a harmonic pattern came up with 75 sats as the potential bottom for this, before it's big run up. I'll post the AB=CD Pattern shortly.
Not trading advice.
Had a look at the TRXBTC chart and (of course this is way too far into the future to tell) just using some trendlines and a harmonic pattern came up with 75 sats as the potential bottom for this, before it's big run up. I'll post the AB=CD Pattern shortly.
Not trading advice.
Note
Note
Alternatively, this. But the other one is more correct time-wise. Note
Added some more trendlines, because there wasn't enough.Now I'll probably totally forget about this idea and miss it.
Note
Alternate idea - if we are in the beginning of a full triangle currently. This would make the end of December the approximate completion date of the triangle.Note
See my comment to ks17471 below for a bit of explanation on this.Disclaimer
The information and publications are not meant to be, and do not constitute, financial, investment, trading, or other types of advice or recommendations supplied or endorsed by TradingView. Read more in the Terms of Use.
Disclaimer
The information and publications are not meant to be, and do not constitute, financial, investment, trading, or other types of advice or recommendations supplied or endorsed by TradingView. Read more in the Terms of Use.