Hello, fellow traders!
Follow us to get the latest information quickly.
Have a great day!
-------------------------------------
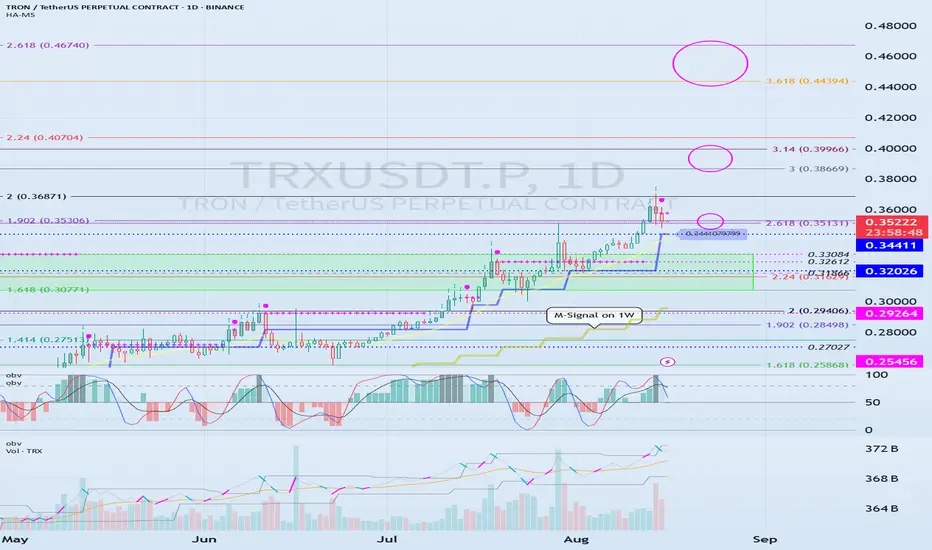
(TRXUSDT 1D Chart)
TRX is one of those coins (tokens) that has a lot of users, yet feels neglected.
For TRX to maintain its uptrend, the price must remain above the 0.30771-0.33084 range.
The circled areas represent important support and resistance zones.
When the M-Signal indicator on the 1W chart rises near the 0.30771-0.33084 range, a price decline below that level is highly likely to trigger a downtrend.
-
Thank you for reading to the end.
I wish you successful trading.
--------------------------------------------------
- This is an explanation of the big picture.
(3-year bull market, 1-year bear market pattern)

I will explain in more detail when the bear market begins.
------------------------------------------------------
Other content (coins, stocks, etc.) is frequently posted on X.
X에 다른 내용(코인, 주식 등)이 자주 게시.
◆ t.me/readCryptoChannel
[HA-MS Indicator]
bit.ly/3YxHgvN
[OBV Indicator]
bit.ly/4dcyny3
X에 다른 내용(코인, 주식 등)이 자주 게시.
◆ t.me/readCryptoChannel
[HA-MS Indicator]
bit.ly/3YxHgvN
[OBV Indicator]
bit.ly/4dcyny3
Related publications
Disclaimer
The information and publications are not meant to be, and do not constitute, financial, investment, trading, or other types of advice or recommendations supplied or endorsed by TradingView. Read more in the Terms of Use.