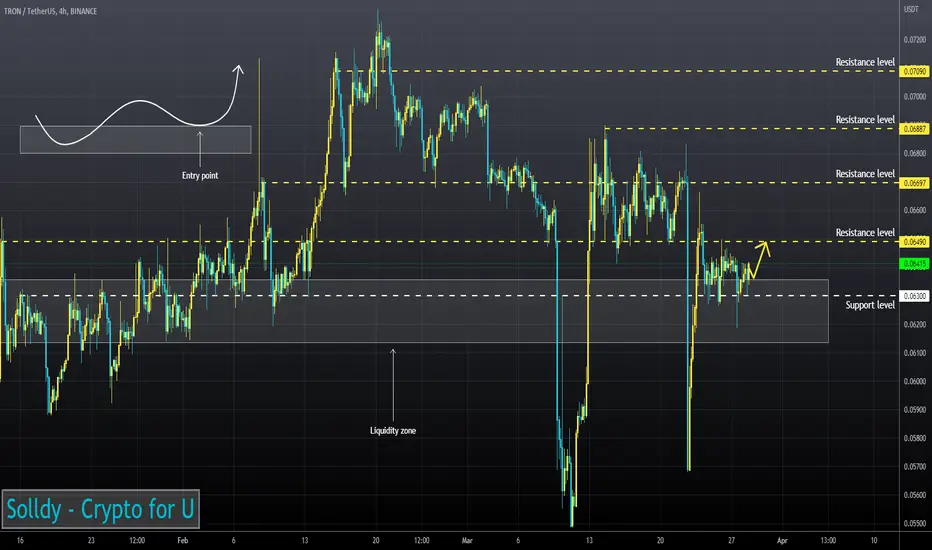
TRX is trading above liquidity.
RSI chart is near neutral values (4H, 1H and 30m TFs)
I believe the asset will continue to rise after fixing above the liquidity zone.
RSI chart is near neutral values (4H, 1H and 30m TFs)
I believe the asset will continue to rise after fixing above the liquidity zone.
Disclaimer
The information and publications are not meant to be, and do not constitute, financial, investment, trading, or other types of advice or recommendations supplied or endorsed by TradingView. Read more in the Terms of Use.
Disclaimer
The information and publications are not meant to be, and do not constitute, financial, investment, trading, or other types of advice or recommendations supplied or endorsed by TradingView. Read more in the Terms of Use.