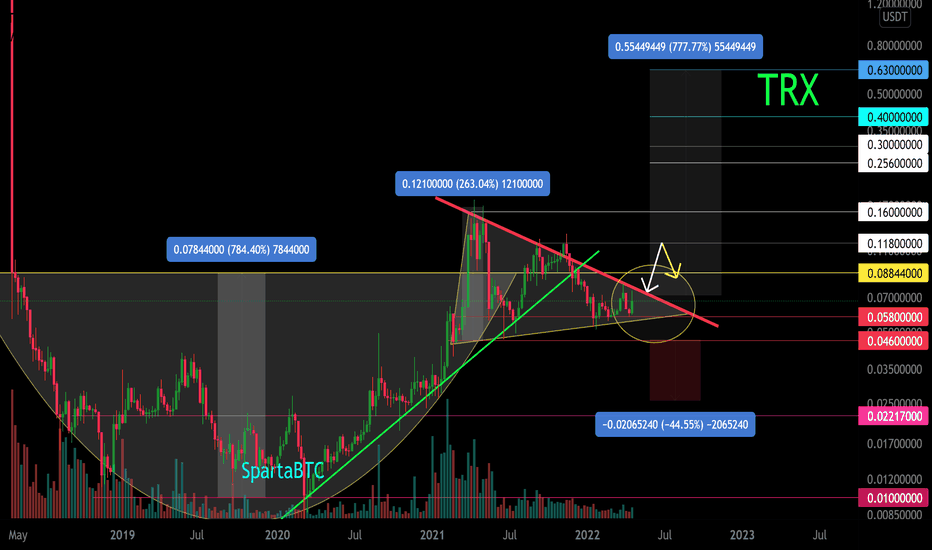
Rising trend. The chart is linear to remove "market noise" and show a clear trend direction and a triangular formation.
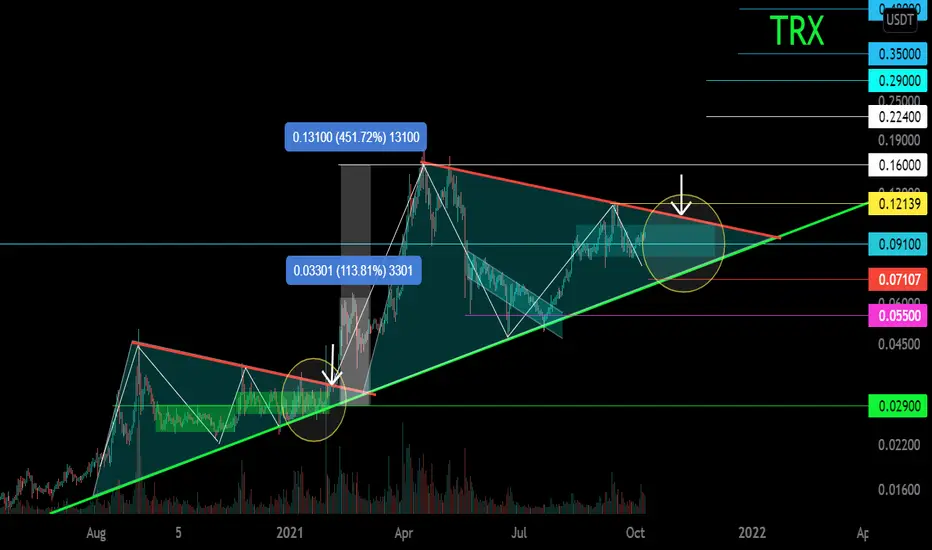
Coin on the coin market: TRON(TRX)
This triangle is on a candlestick chart

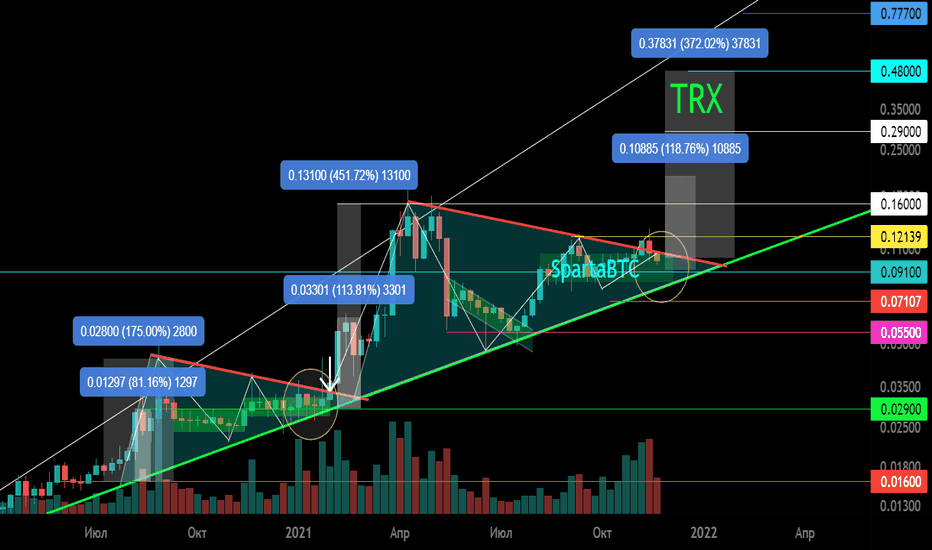
Coin on the coin market: TRON(TRX)
This triangle is on a candlestick chart
Note
Note
Note
Note
Note
Note
Note
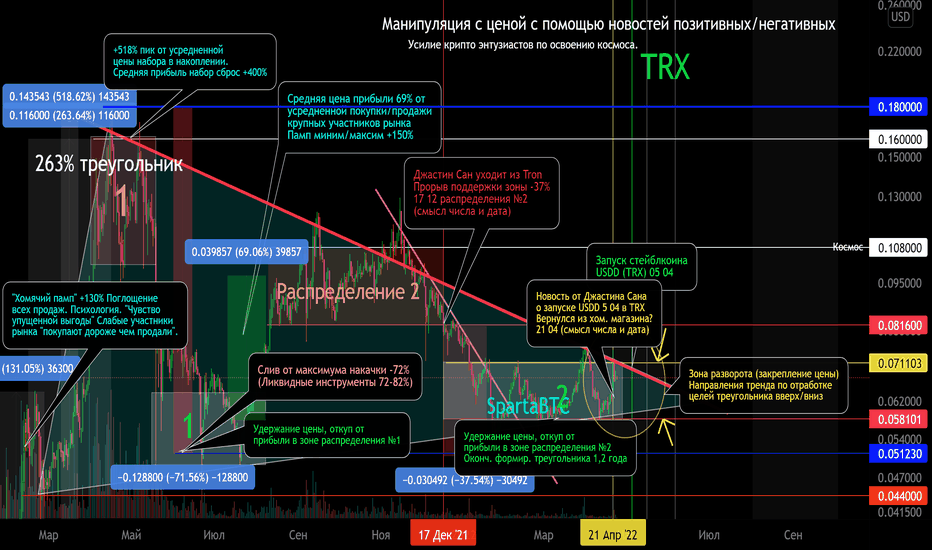
tradingview.com/x/ZeKTvHLf/. Timeframe 1 day. Reaching the 0.055 level indicated earlier. Which became support for the potential formation of a double bottom. A downtrend breakout (purple) and a sideways move, thereby forming a local double bottom (indicated in yellow). There is a fractal similarity with the reversal zone of the previous secondary trend.Note
Note
Note
Note
Note
✅ Telegram. Finance + Trading: t.me/SpartaBTC_1318
✅ Telegram. Сrypto trading only: t.me/SpartaBTC_tradingview
✅ Instagram: instagram.com/spartabtc_1318
✅ YouTube (Rus): goo.su/vpRzRa2
✅ Telegram. Сrypto trading only: t.me/SpartaBTC_tradingview
✅ Instagram: instagram.com/spartabtc_1318
✅ YouTube (Rus): goo.su/vpRzRa2
Disclaimer
The information and publications are not meant to be, and do not constitute, financial, investment, trading, or other types of advice or recommendations supplied or endorsed by TradingView. Read more in the Terms of Use.