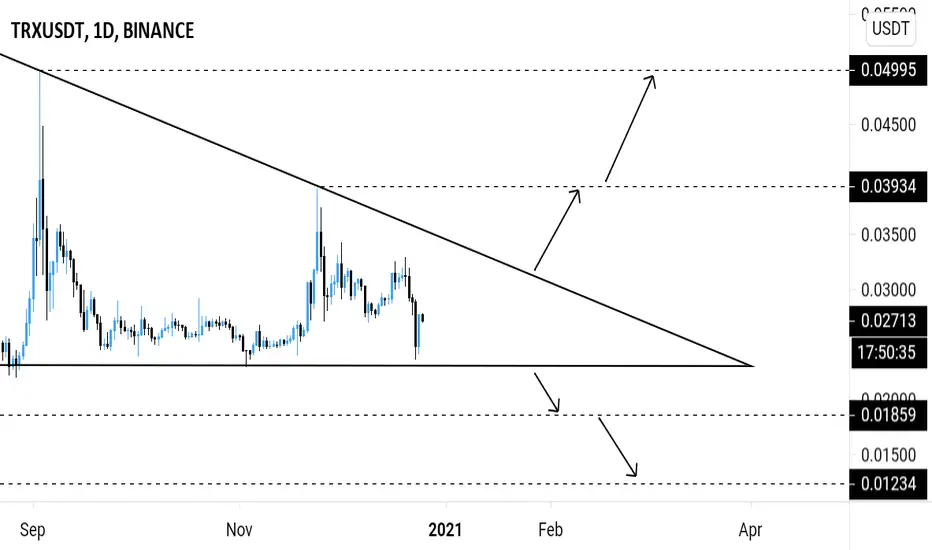
TRXUSDT is printing a descending triangle pattern on the Daily timeframe.
Potential breakout.
Bullish ⬆️ - breakout above the triangle's inclined resistance.
Bearish ⬇️ - breakdown below the triangle's horizontal support.
Potential breakout.
Bullish ⬆️ - breakout above the triangle's inclined resistance.
Bearish ⬇️ - breakdown below the triangle's horizontal support.
Disclaimer
The information and publications are not meant to be, and do not constitute, financial, investment, trading, or other types of advice or recommendations supplied or endorsed by TradingView. Read more in the Terms of Use.
Disclaimer
The information and publications are not meant to be, and do not constitute, financial, investment, trading, or other types of advice or recommendations supplied or endorsed by TradingView. Read more in the Terms of Use.