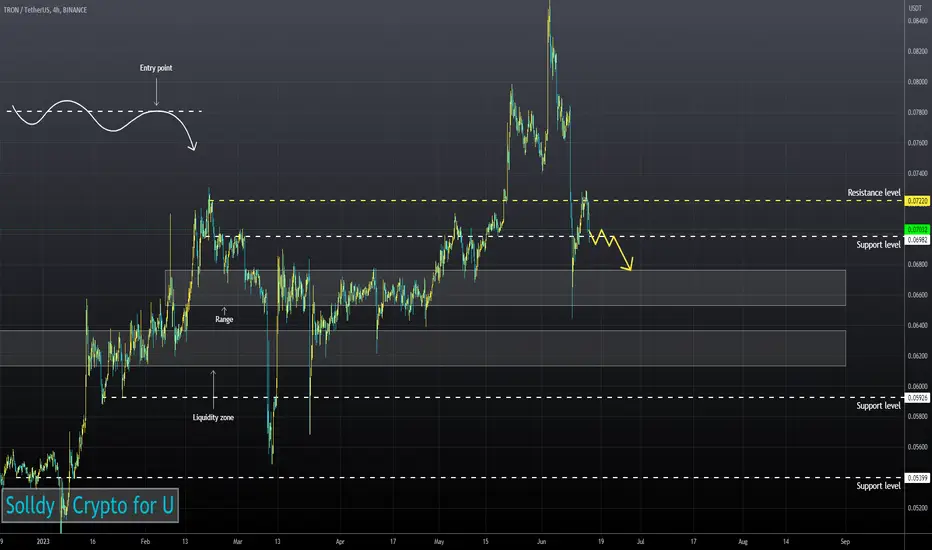
50EMA has broken down 200EMA on the 4H Timeframe.
The RSI chart is moving in bearish zone at 4H, 1H and 30m TFs.
Price has consolidated under 50EMA on the 1H Timeframe.
I believe the asset will continue to decline.
The RSI chart is moving in bearish zone at 4H, 1H and 30m TFs.
Price has consolidated under 50EMA on the 1H Timeframe.
I believe the asset will continue to decline.
Disclaimer
The information and publications are not meant to be, and do not constitute, financial, investment, trading, or other types of advice or recommendations supplied or endorsed by TradingView. Read more in the Terms of Use.
Disclaimer
The information and publications are not meant to be, and do not constitute, financial, investment, trading, or other types of advice or recommendations supplied or endorsed by TradingView. Read more in the Terms of Use.