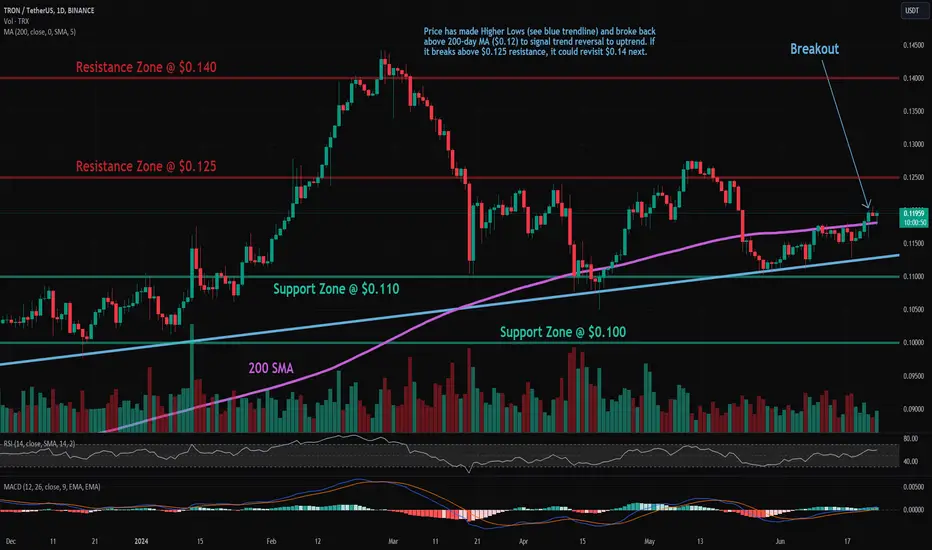
Trade setup: Trends are mixed but improving. Price has made Higher Lows (see blue trendline) and broke back above 200-day MA ($0.12) to signal trend reversal to uptrend. If it breaks above $0.125 resistance, it could revisit $0.14 next.
Pattern: Resistance Breakout. Once a price breaks above a resistance zone, it signals that buyers have absorbed all the supply from sellers at this level and price can resume it's advance. Following a resistance breakout, the next closest resistance zone becomes a price target. Learn to trade key level breakouts in Lesson 7.
Trend: Short-term trend is Strong Up, Medium-term trend is Down and Long-term trend is Down.
Momentum: Price is neither overbought nor oversold currently, based on RSI-14 levels (RSI > 30 and RSI < 70).
Support and Resistance: Nearest Support Zone is $0.11, then $0.10. Nearest Resistance Zone is $0.125, then $0.14.
Disclaimer
The information and publications are not meant to be, and do not constitute, financial, investment, trading, or other types of advice or recommendations supplied or endorsed by TradingView. Read more in the Terms of Use.
Disclaimer
The information and publications are not meant to be, and do not constitute, financial, investment, trading, or other types of advice or recommendations supplied or endorsed by TradingView. Read more in the Terms of Use.